What Touch Controls actually does (from store listing)
<b>Touch Controls</b>
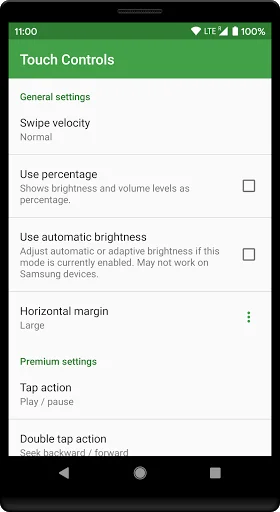
Touch Controls provides VLC-style gesture-based brightness and volume controls for the YT app when playing videos in full screen mode.
You can increase or decrease the volume by swiping your finger up or down on the right side of the screen. Swiping the finger on the left adjusts the screen brightness.
Only the official YT and YT Go apps are supported.
Go premium to enable:
• Brightness controls
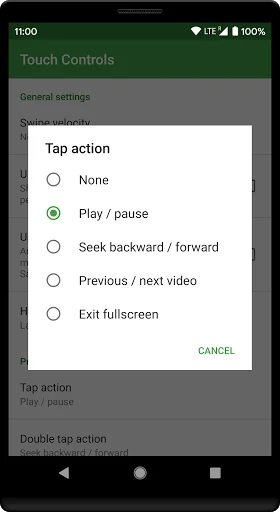
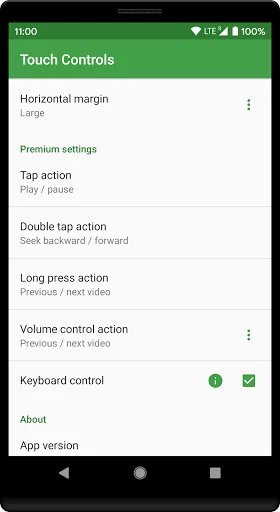
• Tap action
• Double tap action
• Long press action
• …
Touch Controls provides VLC-style gesture-based brightness and volume controls for the YT app when playing videos in full screen mode.
You can increase or decrease the volume by swiping your finger up or down on the right side of the screen. Swiping the finger on the left adjusts the screen brightness.
Only the official YT and YT Go apps are supported.
Go premium to enable:
• Brightness controls
• Tap action
• Double tap action
• Long press action
• Volume control action
• Seek support
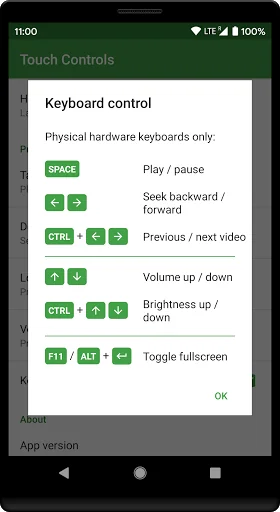
• Keyboard control
If the overlays do not work please try restarting the device.
This app uses accessibility services to:
• Detect when the YT/YT Go app is playing videos in fullscreen. This will activate the transparent touch overlays to control the screen brightness and volume.
• Perform touch gestures in order to make the player controls visible.
• Listen to key presses to support the hardware keyboard control functionality.
The accessibility service is limited to the YT/YT Go app. It will not receive events from any other app. The app does not obtain or collect any personal information related to your YT activity.
Comparable Android apps
The five apps in Tools with the closest revenue to Touch Controls. Click any to see its detail page.
Each forecast combines App Store rating, ratings count, monetisation model, pricing tier, IAP signals and ad-supported flag.
The base estimate is then multiplied by a per-category scaling factor learned from apps with founder-verified MRR.
Every number on this page comes from public APIs and bumetric's own snapshot history.
Full methodology covers input variables, accuracy bands per category and how we treat apps without comparable anchors.
See also the live data on Touch Controls's tracker page for current rating, reviews and snapshot timeline.
Building something similar? Get a free AI audit with $-revenue forecasts for every recommendation.

 Robo.com3
 Especialista Nice 2.0
 Miro SmartHome
 Bouygues Telecom - Entreprises
 Urdu Text To Speech