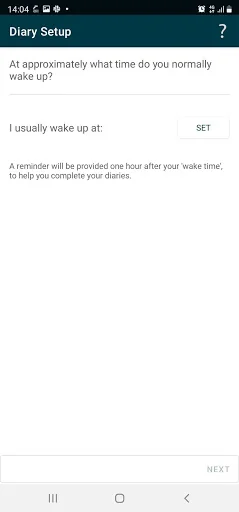
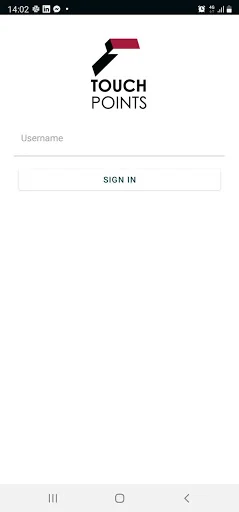
What TouchPoints actually does (from store listing)
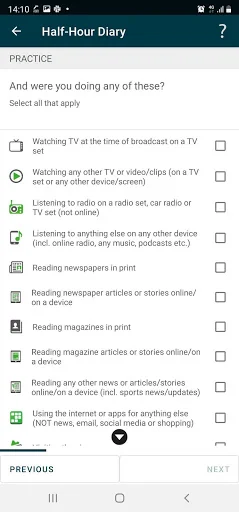
TouchPoints is a market research application that captures study participants' behaviour and usage of different media. We do this by asking participants to complete survey questions every half hour for a 7 day period. When a participant’s device is connected to the internet, their answers and usage information are then sent securely to a remote server for analysis.
THIS APP USES ACCESSIBILITY SERVICES
This app uses Accessibility services. TouchPoints can use this permission with active conse…
TouchPoints is a market research application that captures study participants' behaviour and usage of different media. We do this by asking participants to complete survey questions every half hour for a 7 day period. When a participant’s device is connected to the internet, their answers and usage information are then sent securely to a remote server for analysis.
THIS APP USES ACCESSIBILITY SERVICES
This app uses Accessibility services. TouchPoints can use this permission with active consent of the end-user to analyse the application and web usage on this device as part of an opt-in market research panel.
Comparable Android apps
The five apps in Lifestyle with the closest revenue to TouchPoints. Click any to see its detail page.
Each forecast combines App Store rating, ratings count, monetisation model, pricing tier, IAP signals and ad-supported flag.
The base estimate is then multiplied by a per-category scaling factor learned from apps with founder-verified MRR.
Every number on this page comes from public APIs and bumetric's own snapshot history.
Full methodology covers input variables, accuracy bands per category and how we treat apps without comparable anchors.
See also the live data on TouchPoints's tracker page for current rating, reviews and snapshot timeline.
Building something similar? Get a free AI audit with $-revenue forecasts for every recommendation.


 나비엔 스마트톡 보일러 (구버전)
 Jawani Ki Shayari
 Kinder - Find Baby Names
 Quilt Cat - For every quilter
 Health Plus