ML revenue forecast.
Calibrated against 29524 apps in this category.
Confidence band
±15%
High — many comparable apps with verified data
At a glance
Earns 7.84× more than the category median (192/mo).
Ranks #1,667 of 29,524 in Puzzle (top 5.6% by revenue).
Launched May 06, 2026 · last updated Apr 13, 2026.
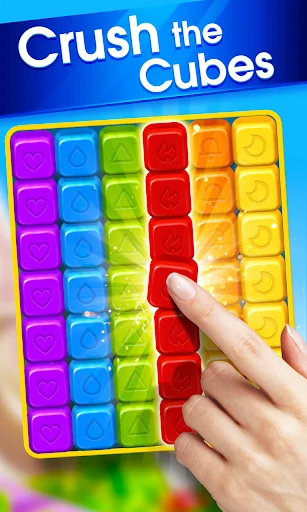
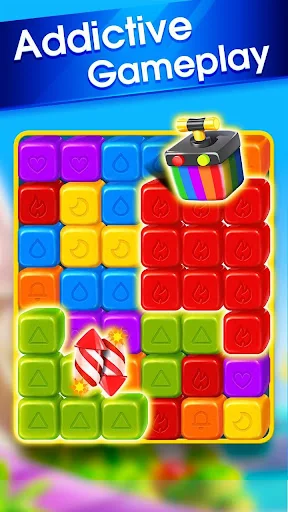
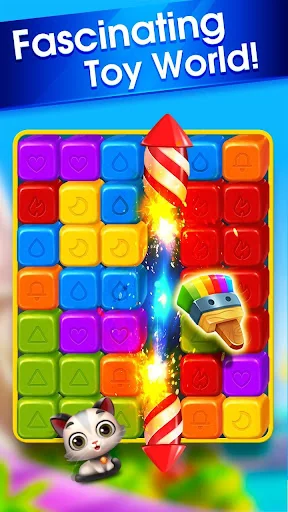
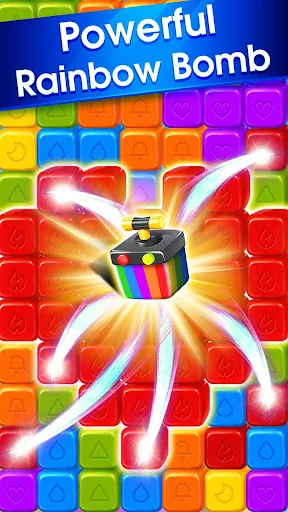
What the app looks like
Live screenshots from the Play Store, captured by our snapshot worker. Tap any image to enlarge.
Toy Crush's revenue trajectory
Forecast revenue from snapshot history. Last 1 months.
Where Toy Crush sits in Puzzle
Revenue distribution of 29524 comparable apps. Toy Crush highlighted.
Toy Crush vs comparable apps
Revenue trajectory side-by-side. Bold = Toy Crush, ghosted = peers.
App spec
Version
5.10.1362
Last update
Apr 13, 2026
Launched
May 06, 2026
Price
Free
Monetization
Free
What Toy Crush actually does (from store listing)
<b>Best Casual Matching Game Ever </b>
Click on any 2 adjacent toy cubes of the same. Enjoy the amazing toy world in Toy Crush!
<b>How to Play</b>
- Tap 2 or more adjacent cubes of the same to crush
- Break up eggs to collect gummy bears
- Achieve required score to pass levels, no time limit
- The more cubes get crushed each move, the higher score you will get
<b>Toy Crush Features</b>
- 144 brand new levels which are full of interesting toys
- Popular and classic gameplay
- Color…
Best Casual Matching Game Ever Click on any 2 adjacent toy cubes of the same. Enjoy the amazing toy world in Toy Crush!
How to Play - Tap 2 or more adjacent cubes of the same to crush
- Break up eggs to collect gummy bears
- Achieve required score to pass levels, no time limit
- The more cubes get crushed each move, the higher score you will get
Toy Crush Features - 144 brand new levels which are full of interesting toys
- Popular and classic gameplay
- Colorful and delicate cubes design
- Whip your way through Easter Town, Icicle Tunnel and Jelly Maze
- Build up your toy block by collecting more cubes
- Playing addictive game for FREE
All toy lovers! Collect as many wonderful toys as you want in Toy Crush!
Comparable Android apps
The five apps in Puzzle with the closest revenue to Toy Crush. Click any to see its detail page.
Each forecast combines App Store rating, ratings count, monetisation model, pricing tier, IAP signals and ad-supported flag.
The base estimate is then multiplied by a per-category scaling factor learned from apps with founder-verified MRR.
Every number on this page comes from public APIs and bumetric's own snapshot history.
Full methodology covers input variables, accuracy bands per category and how we treat apps without comparable anchors.
See also the live data on Toy Crush's tracker page for current rating, reviews and snapshot timeline.
Building something similar? Get a free AI audit with $-revenue forecasts for every recommendation.
 Design Masters: Home Simulator
 Push Roll
 Galaxy
 Mystery Hidden Objects
 Bubble Blast Holiday