What Trade Calculators : Gann Squar actually does (from store listing)
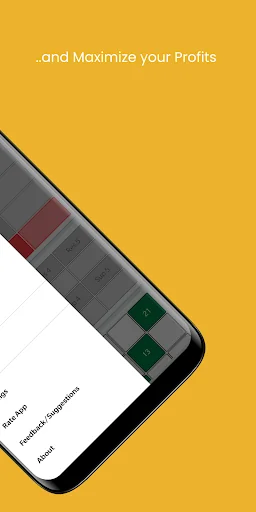
Gann Square of 9 and Pivot Points are hugely popular and used widely. Please use our Trade Calculators and precisely determine the trading levels, blend it with technical or Price Action analysis and maximize your profits.
<b>Features</b>
* Calculate accurate levels with 6 digit precision using:
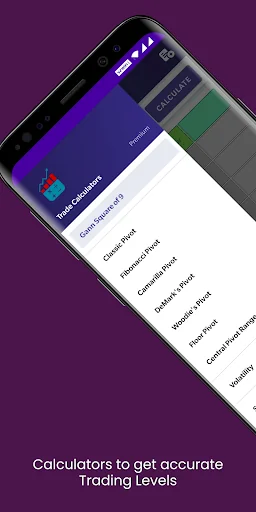
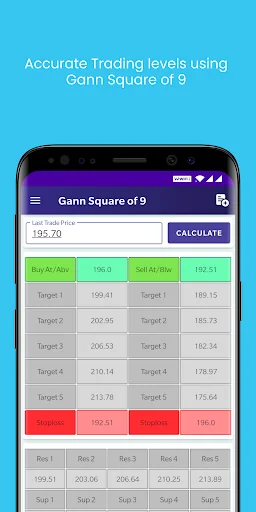
- Gann Square Of 9 Calculator
- Classic Pivot Points
- Fibonacci Pivot
- Camarilla Pivot
- DeMark's Pivot
- Woodie's Pivot
- Floor Pivot
- Central Pivot Range (CPR)
- Volatility Calculator
…
Gann Square of 9 and Pivot Points are hugely popular and used widely. Please use our Trade Calculators and precisely determine the trading levels, blend it with technical or Price Action analysis and maximize your profits.
Features * Calculate accurate levels with 6 digit precision using:
- Gann Square Of 9 Calculator
- Classic Pivot Points
- Fibonacci Pivot
- Camarilla Pivot
- DeMark's Pivot
- Woodie's Pivot
- Floor Pivot
- Central Pivot Range (CPR)
- Volatility Calculator
* Now you can save a list of OHLC values and use them in calculators.
Who is this Application for Whether you are a price action, a pattern, an indicator or any other trader, ability to identify strong price levels on your charts can greatly improve the quality and profitability of your trading. Instead of taking false signals and wrong trades, the better trades usually happen at key price levels. Those strong areas of interest show that buyers and sellers are concentrating at certain levels and these can be the starting or turning points for new price moves and can mark new trends as well.
If you are a breakout trader, you need to find areas that can lead to strong breakouts, if you are a trend-following trader you must identify pullback areas or trend continuation points, a reversal trader looks for key turning points and a range trader should focus on well-developed ranges with clearly defined price levels.
Expert analysts or experienced traders always use certain tools and techniques to ascertain support or resistance level, each of which is important because it represents a point at which a major price movement is expected to occur.
Note: Saved OHLC list will be deleted if Application is un-installed or App data is cleaned. As of now, there is no provision for remote back-up of data.
* Use Trade Calculators to plan your trades and always trade with a plan.
* Our level finding trading calculators are some great ways to identify areas of support and resistance, but they work best when combined with other kinds of technical analysis
* Trade Calculators : Gann Square of 9 and Pivots is a tool to help you find the levels for support, resistance and targets, however, responsibility for any trades taken based on the levels generated using this tool will solely rely on the user. The developer or the ApverS team will not be held responsible for any losses or gains whatsoever.
* For any Feedback, Suggestions, Bug Reporting, or just to say Hi, please mail at tradecalc.apvers@gmail.com
Premium Features - Ad-Free Experience - Remove all ads
- Add unlimited OHLC value sets
- Access to all future calculators
- Valid for Lifetime
Disclosure/Disclaimer 1. This application is only for educational purpose. It uses standard mathematical formulas to determine various support and resistance levels. It does not assure any kind of firm resistance and support values for trading purpose.
2. The user of this application understands the risks involved in trading based on volatility in the market and the universal circumstances. Hence, the User of the application will alone be responsible for trades carried based on levels generated in the application.
3. No legal liability will be taken by the developer in any circumstances for any losses or gains made by using the application.
Permission Details:
–––––––––––––––––––
* Permission Needed for targeted ads and GDPR Compliance
- INTERNET
- NETWORK_STATE
- LOCATION
Comparable Android apps
The five apps in Finance with the closest revenue to Trade Calculators : Gann Squar. Click any to see its detail page.
Each forecast combines App Store rating, ratings count, monetisation model, pricing tier, IAP signals and ad-supported flag.
The base estimate is then multiplied by a per-category scaling factor learned from apps with founder-verified MRR.
Every number on this page comes from public APIs and bumetric's own snapshot history.
Full methodology covers input variables, accuracy bands per category and how we treat apps without comparable anchors.
See also the live data on Trade Calculators : Gann Squar's tracker page for current rating, reviews and snapshot timeline.
Building something similar? Get a free AI audit with $-revenue forecasts for every recommendation.
 Woori WON Global
 مصارف (دخل و خرج)
 Qahera Cash
 MO First
 Shinhan Bank Indonesia SOL