What Travel Expense actually does (from store listing)
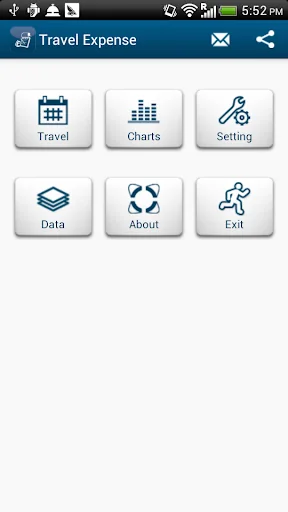
Travel Expense helps you to record your expense during traveling, i.e. on a business trip, an out of the office appointment or a person vacation.
[Features]
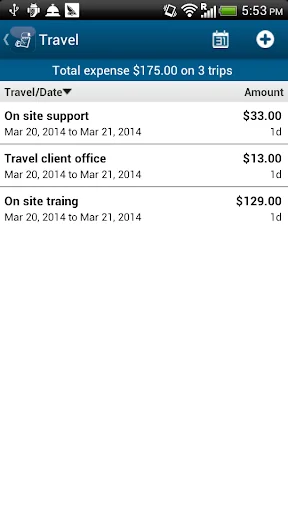
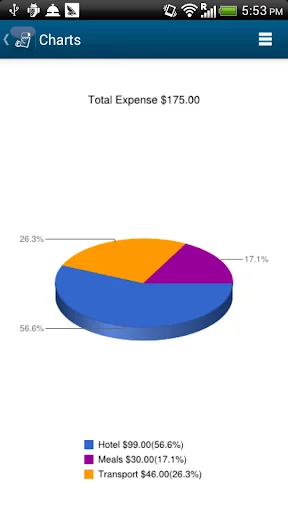
1. Display total amount of travel expense in home currency and local currency.
2. Travel Expense report in csv, html and excel xml
3. Export/Email expense report
4. Backup and restore database to SD card, Dropbox™ and Google Docs
5. Auto backup database to SD card when exiting the app
6. Auto backup database to Dropbox™ when exitin…
Travel Expense helps you to record your expense during traveling, i.e. on a business trip, an out of the office appointment or a person vacation.
[Features]
1. Display total amount of travel expense in home currency and local currency.
2. Travel Expense report in csv, html and excel xml
3. Export/Email expense report
4. Backup and restore database to SD card, Dropbox™ and Google Docs
5. Auto backup database to SD card when exiting the app
6. Auto backup database to Dropbox™ when exiting the app
7. Manageable currency
8. Configurable date, time format.
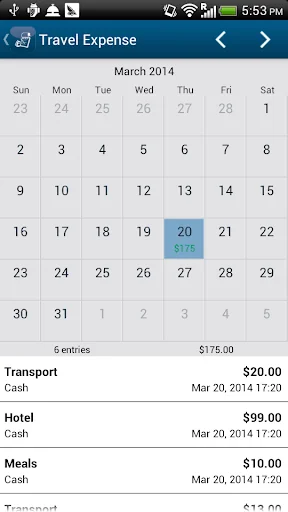
9. Add new record with default value.
10. Password protection
11. Default email address for receiving report
12. Add new expense with default value
13. Camera receipt
14. Sorting, Filtering data
15. Share database with multiple devices by using Dropbox™
Available languages (more coming soon) • English
• 中文
• Italiano (Paolo Stefani)
• Français (Jean-Marie)
• Español (Paolo Stefani)
[Upgrade to pay version]
1. Buy and install pay version
2. Backup database of lite version (Data->Pay Version Database)
3. Install the backup database to pay version (Data=>Restore Database)
※ This is lite version which has limited features, likes password, email and export.
※ If you like the app, then please give us a good rating as the driving force behind our continued development, thank you.
※ Since we can't reply reviews in the market, if you have any suggestions or questions please mail to our mailbox directly. For market reviews, please just leave your rating and cheers, thanks again.
Comparable Android apps
The five apps in Business with the closest revenue to Travel Expense. Click any to see its detail page.
Each forecast combines App Store rating, ratings count, monetisation model, pricing tier, IAP signals and ad-supported flag.
The base estimate is then multiplied by a per-category scaling factor learned from apps with founder-verified MRR.
Every number on this page comes from public APIs and bumetric's own snapshot history.
Full methodology covers input variables, accuracy bands per category and how we treat apps without comparable anchors.
See also the live data on Travel Expense's tracker page for current rating, reviews and snapshot timeline.
Building something similar? Get a free AI audit with $-revenue forecasts for every recommendation.

 Showpad
 Grason
 Dana Products Catalogue
 Dtabs
Dtabs
 اشتراكات شركة ماي واي my way