Android app
from Via Transportation Inc.
· Maps & Navigation
ML forecast★ 4.6 · 123Free
~95/mo
ML revenue forecast.
Calibrated against 14173 apps in this category.
Confidence band
±15%
High — many comparable apps with verified data
At a glance
Earns 1.9× less than the category median (180/mo).
Ranks #13,646 of 14,173 in Maps & Navigation (top 96.3% by revenue).
Launched Jun 07, 2020.
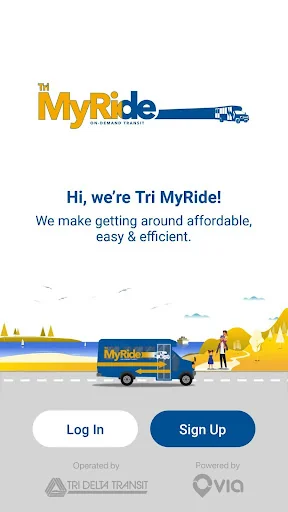
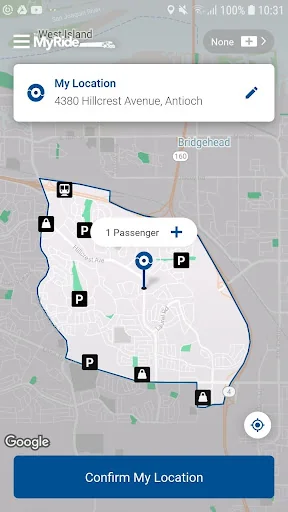
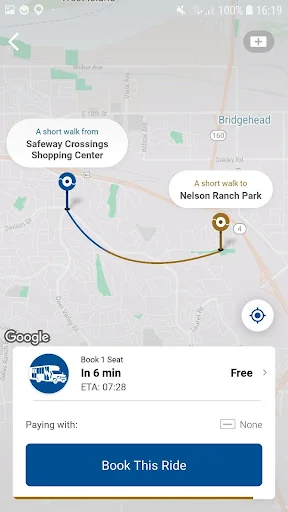
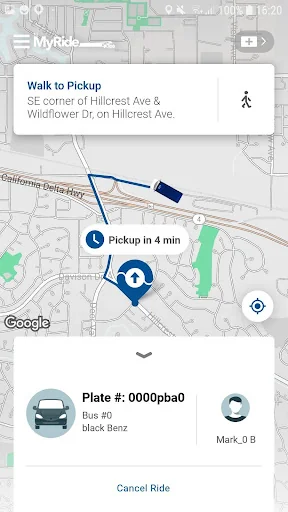
What the app looks like
Live screenshots from the Play Store, captured by our snapshot worker. Tap any image to enlarge.
Tri MyRide's revenue trajectory
Forecast revenue from snapshot history. Last 1 months.
Where Tri MyRide sits in Maps & Navigation
Revenue distribution of 14173 comparable apps. Tri MyRide highlighted.
Tri MyRide vs comparable apps
Revenue trajectory side-by-side. Bold = Tri MyRide, ghosted = peers.
App spec
Version
Varies with device
Launched
Jun 07, 2020
Price
Free
Monetization
Free
What Tri MyRide actually does (from store listing)
Tri MyRide –The most efficient way to get to BART!
Tri MyRide is an on-demand ride-sharing service operated by Tri Delta Transit. Use Tri MyRide for safe, efficient, and affordable travel to Antioch or Pittsburg/Bay Point BART as well as popular shopping destinations. Tri MyRide is convenient and easy to use - simply use the app to select your pick-up and drop-off points and a vehicle will meet you at a nearby corner!
How much does a Tri MyRide cost?
$2 flat fare
When can I travel…
Tri MyRide –The most efficient way to get to BART!
Tri MyRide is an on-demand ride-sharing service operated by Tri Delta Transit. Use Tri MyRide for safe, efficient, and affordable travel to Antioch or Pittsburg/Bay Point BART as well as popular shopping destinations. Tri MyRide is convenient and easy to use - simply use the app to select your pick-up and drop-off points and a vehicle will meet you at a nearby corner!
How much does a Tri MyRide cost?
$2 flat fare
When can I travel?
Tri MyRide operates Monday to Friday, 5 am – 9 pm.
How long will I wait?
You will always get an accurate estimate of your pick-up ETA before booking. Once Tri MyRide is on route to pick you up you can track your ride in real-time using the app.
How many passengers will I share a vehicle with?
The number of passengers varies based on demand.
Love our app? Please rate us!
Questions? Email us at comments@trimyride.com
Comparable Android apps
The five apps in Maps & Navigation with the closest revenue to Tri MyRide. Click any to see its detail page.
Each forecast combines App Store rating, ratings count, monetisation model, pricing tier, IAP signals and ad-supported flag.
The base estimate is then multiplied by a per-category scaling factor learned from apps with founder-verified MRR.
Every number on this page comes from public APIs and bumetric's own snapshot history.
Full methodology covers input variables, accuracy bands per category and how we treat apps without comparable anchors.
See also the live data on Tri MyRide's tracker page for current rating, reviews and snapshot timeline.
Building something similar? Get a free AI audit with $-revenue forecasts for every recommendation.
 Le bus à la demande
 Xe Tải Đà Nẵng
 Transcootour Rio de Janeiro
 Smart Tracker
 LineNetwork Bochum