Whether you’re at work and need to stay connected, or you’re at home and need to access benefits or payroll information, some things can’t afford to wait until you get back to your work computer. With the redesigned TriNet Mobile app, employees can access important HR details, and admins have the freedom and flexibility to manage HR from the palm of their hands. TriNet Mobile is available for free to all active TriNet employees, and provides secure access to your HR information.
Key Capabilit…
Whether you’re at work and need to stay connected, or you’re at home and need to access benefits or payroll information, some things can’t afford to wait until you get back to your work computer. With the redesigned TriNet Mobile app, employees can access important HR details, and admins have the freedom and flexibility to manage HR from the palm of their hands. TriNet Mobile is available for free to all active TriNet employees, and provides secure access to your HR information.
Key Capabilities:
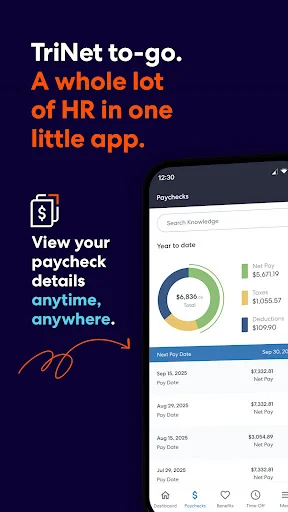
* Money - View a summary of your most recent paycheck with a detailed breakdown of earnings, taxes and benefits. Compare previous paychecks and access W-2 and W-4 forms. Admins can review and approve payroll on the go.
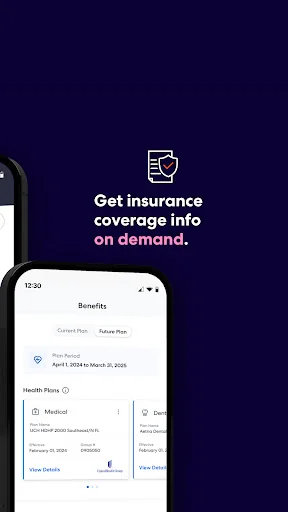
* Benefits - Access member identification cards from certain medical insurance providers for yourself and covered family members. View TriNet benefits coverage including medical, life, disability and flexible spending account details. During TriNet’s annual Open Enrollment, review and re-enroll in your current benefit plans.
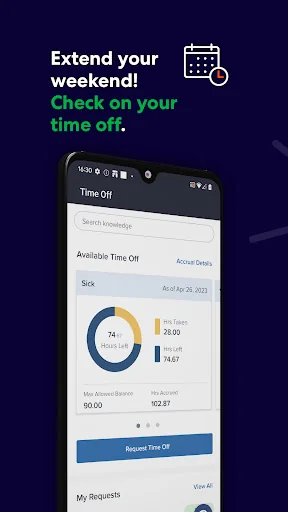
* Time Off - View your available balance and request time off. Managers and admins can approve time off for team members.
* Flexible Spending Accounts: View your transaction details and status, or submit claims and receipts.
* Perks – Access popular deals including discounts on movie tickets, restaurants, car rentals and Apple devices.
* Directory/Team – View profiles of your manager, colleagues and team members, and contact them easily through call, email and chat.
* My To Do’s – View and complete employee to-do items directly from the dashboard (time off requests, expense reports, etc.).
* Security – Stay protected through password or biometric security using your TriNet credentials and multi-factor authentication.
* HR – Admins with permissions can add new hires, view employee information such as profile, work, benefits and pay details.
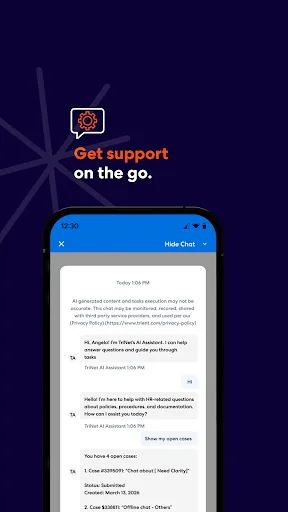
Using the app means you agree to our Terms of Use and Privacy Policy:
* https://www.trinet.com/platform-terms
* https://www.trinet.com/privacy-policy
Comparable Android apps
The five apps in Business with the closest revenue to TriNet. Click any to see its detail page.
Each forecast combines App Store rating, ratings count, monetisation model, pricing tier, IAP signals and ad-supported flag.
The base estimate is then multiplied by a per-category scaling factor learned from apps with founder-verified MRR.
Every number on this page comes from public APIs and bumetric's own snapshot history.
Full methodology covers input variables, accuracy bands per category and how we treat apps without comparable anchors.
See also the live data on TriNet's tracker page for current rating, reviews and snapshot timeline.
Building something similar? Get a free AI audit with $-revenue forecasts for every recommendation.

 IBM MaaS360 Docs
 Excellence Driving
 Decibel HRMS
 KaHero POS - Point of Sale
 Invoice King