What TriNet Expense actually does (from store listing)
Terms of Use: https://www.trinet.com/terms-vp
Privacy Policy: https://www.trinet.com/privacy-policy
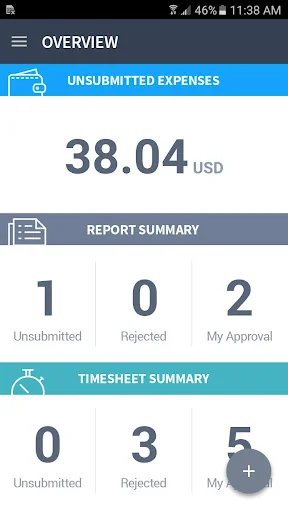
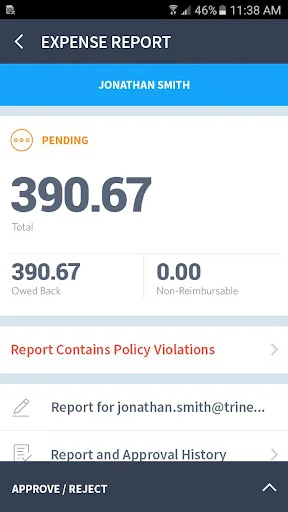
TriNet Expense is an mobile and online expense reporting solution, helping companies manage the entire expense reporting process with ease. With instant self-service setup, support for 20,000+ credit and bank cards, 160 currencies, mileage tracking via Google maps, project based time tracking, receipt management, online approval tracking, and expense policy enforcement, TriNet Expense is th…
Terms of Use: https://www.trinet.com/terms-vp
Privacy Policy: https://www.trinet.com/privacy-policy
TriNet Expense is an mobile and online expense reporting solution, helping companies manage the entire expense reporting process with ease. With instant self-service setup, support for 20,000+ credit and bank cards, 160 currencies, mileage tracking via Google maps, project based time tracking, receipt management, online approval tracking, and expense policy enforcement, TriNet Expense is the best solution for SMB's.
The TriNet Expense mobile application for Android allows you to capture receipts, mileage expenses, time and expenses while on the go, including the ability to edit existing business travel expenses already entered. Expenses can be submitted via the mobile application or online, and exported for reimbursement through our add-on integrations like FreshBooks, QuickBooks, Intacct or NetSuite (Integrations require a premium subscription). By using TriNet Expense, you will save time, speed up approval processes and cut operational cost when reimbursing employees.
TriNet Expense is one of many strategic services brought to you by TriNet Group, Inc. Thousands of organizations have turned to TriNet for human resources, benefits, payroll, workers' compensation, and strategic human capital services. As their trusted HR business partner, TriNet helps these companies contain HR costs, minimize employer-related risk, and relieve the administrative burden of HR.
Comparable Android apps
The five apps in Finance with the closest revenue to TriNet Expense. Click any to see its detail page.
Each forecast combines App Store rating, ratings count, monetisation model, pricing tier, IAP signals and ad-supported flag.
The base estimate is then multiplied by a per-category scaling factor learned from apps with founder-verified MRR.
Every number on this page comes from public APIs and bumetric's own snapshot history.
Full methodology covers input variables, accuracy bands per category and how we treat apps without comparable anchors.
See also the live data on TriNet Expense's tracker page for current rating, reviews and snapshot timeline.
Building something similar? Get a free AI audit with $-revenue forecasts for every recommendation.



 Global Indices/Stocks Update
 Westpac NZ CashNav
 모인 해외송금 MOIN
 Harvard FCU Digital Banking
 Venda Fácil