TRU: Redefine Financial Freedom
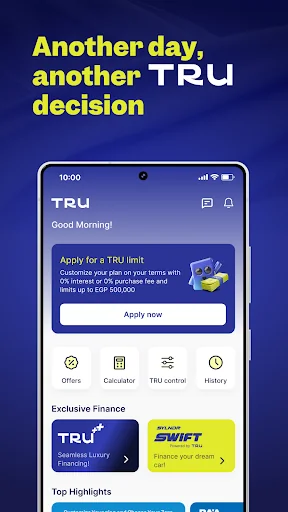
TRU is your ultimate financial partner, designed to put flexibility and control at your fingertips.
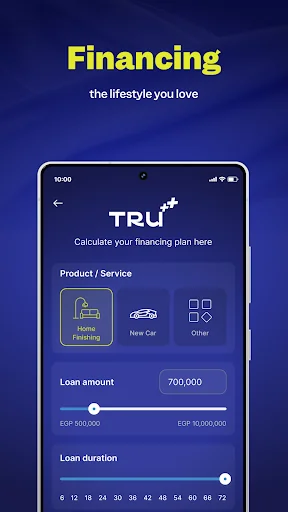
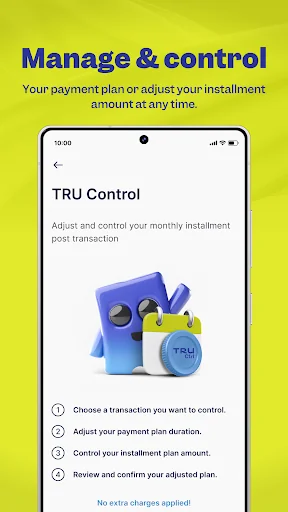
With TRU, you can customize your financial experience, whether it’s planning your payments, managing purchases, or exploring exciting deals—all while enjoying a seamless and secure app.
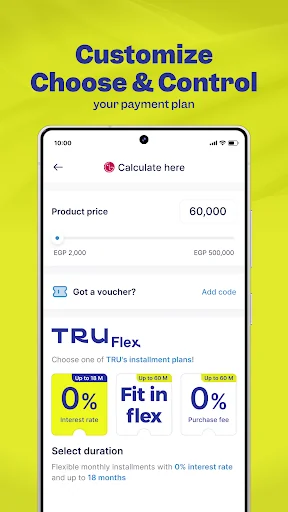
TRU FLEX: CHOOSE YOUR ZERO
The game-changing feature enables you to choose how to pay.
Whether you prefer zero down payment, zero interest, or zero fees, TRU Flex em…
TRU is your ultimate financial partner, designed to put flexibility and control at your fingertips.
With TRU, you can customize your financial experience, whether it’s planning your payments, managing purchases, or exploring exciting deals—all while enjoying a seamless and secure app.
TRU FLEX: CHOOSE YOUR ZERO
The game-changing feature enables you to choose how to pay.
Whether you prefer zero down payment, zero interest, or zero fees, TRU Flex empowers you to create a payment plan perfectly aligned with your needs.
SHOP FROM EGYPT’S TOP MERCHANTS
Access a diverse network of trusted merchants across Egypt. Whether you’re shopping for everyday essentials or high-value items, TRU connects you to the best deals and experiences.
EFFORTLESS SCAN AND PAY
Simplify your checkout process with TRU’s easy scan-and-pay feature.
Complete your transactions quickly and securely with just a few taps.
DAILY EXCLUSIVE OFFERS
Save more every day with new deals and promotions tailored for you.
Manage your finances the right way.. It’s not right unless it’s TRU!
Download TRU now
Under supervision and regulation of FRA
Consumer Finance License Number 36, year 2022
Comparable Android apps
The five apps in Finance with the closest revenue to TRU. Click any to see its detail page.
Each forecast combines App Store rating, ratings count, monetisation model, pricing tier, IAP signals and ad-supported flag.
The base estimate is then multiplied by a per-category scaling factor learned from apps with founder-verified MRR.
Every number on this page comes from public APIs and Bumetric's own snapshot history.
Full methodology covers input variables, accuracy bands per category and how we treat apps without comparable anchors.
See also the live data on TRU's tracker page for current rating, reviews and snapshot timeline.
Building something similar? Get a free AI audit with $-revenue forecasts for every recommendation.


 Personal Loans & Credit Cards
 Dollar and Euro: Exchange Rate
 อัตราแลกเปลี่ยน - THB Currency
 MBL M-Smart
 Dairyland®