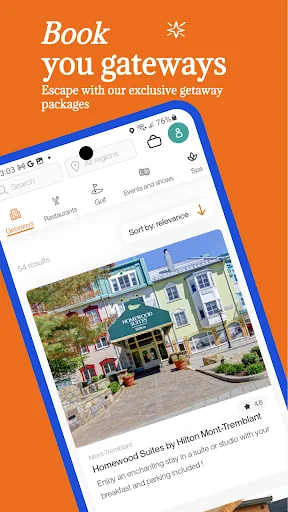
For 15 years, Tuango has been bringing you incredible deals across Québec. Now, with our brand-new app, discovering the best spas, shows, getaways, restaurants, activities, and more has never been easier!
And that’s not all—our new app comes packed with exciting features:
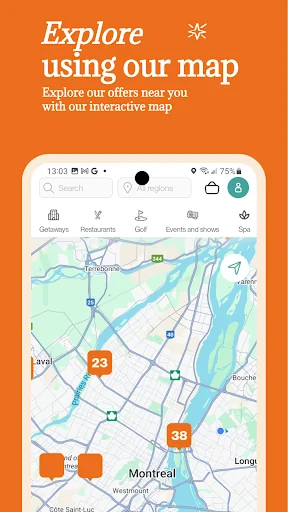
• Interactive map
• New filters
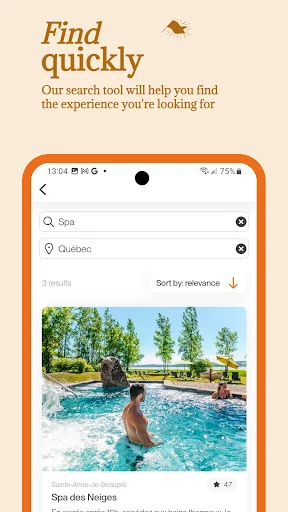
• Advanced search
• And more!
Join the hundreds of thousands of Québecers who have loved our deals for over a decade. Subscribe to offers tailored to your region, earn points on every purch…
For 15 years, Tuango has been bringing you incredible deals across Québec. Now, with our brand-new app, discovering the best spas, shows, getaways, restaurants, activities, and more has never been easier!
And that’s not all—our new app comes packed with exciting features:
• Interactive map
• New filters
• Advanced search
• And more!
Join the hundreds of thousands of Québecers who have loved our deals for over a decade. Subscribe to offers tailored to your region, earn points on every purchase, and keep your coupons in the app for easy access.
Download the app for free and start enjoying the best deals in Québec today!
Comparable Android apps
The five apps in Shopping with the closest revenue to Tuango. Click any to see its detail page.
Each forecast combines App Store rating, ratings count, monetisation model, pricing tier, IAP signals and ad-supported flag.
The base estimate is then multiplied by a per-category scaling factor learned from apps with founder-verified MRR.
Every number on this page comes from public APIs and bumetric's own snapshot history.
Full methodology covers input variables, accuracy bands per category and how we treat apps without comparable anchors.
See also the live data on Tuango's tracker page for current rating, reviews and snapshot timeline.
Building something similar? Get a free AI audit with $-revenue forecasts for every recommendation.


 T.J.Maxx
 Садовод - База поставщиков
 The Vitamin Shoppe - VShoppe
 Topup Flow
 WalaPlus | ولاء بلس