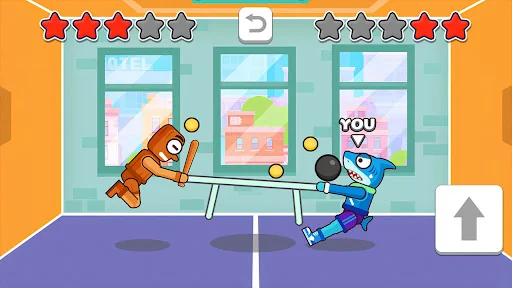
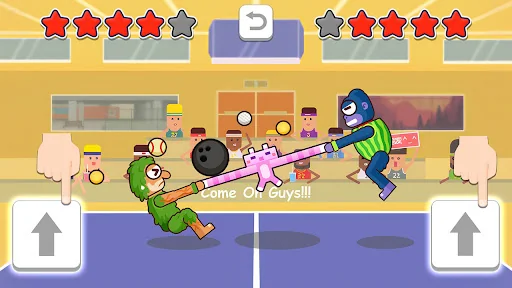
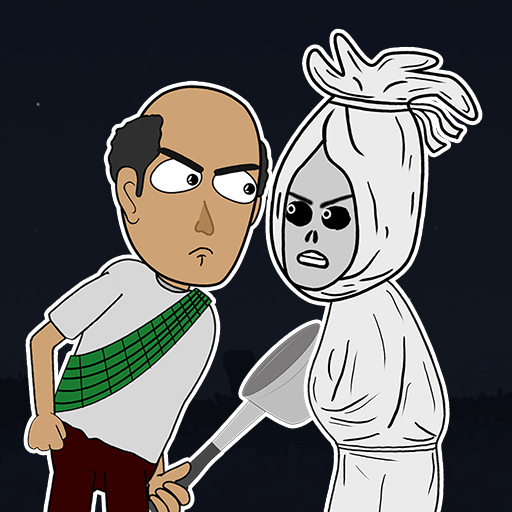
This is a simple funny against game. Yes, though it looks funny, it really a against game...
Blue and red colours are the classical character pairing from very early time. There are two little people in blue and red color.
The only things you need to do is handling one of them, and pull the another one over the white line.
People will lost if he over the white line. Yes, thing is simple. As for those lose their head during the drastic progress of the game, we are not in charge of them…
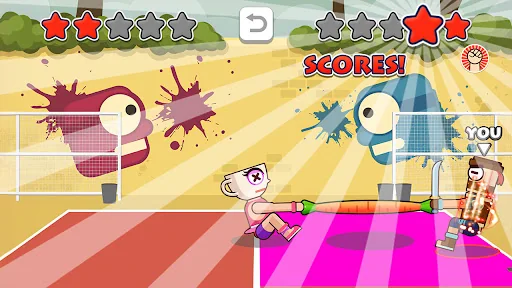
This is a simple funny against game. Yes, though it looks funny, it really a against game...
Blue and red colours are the classical character pairing from very early time. There are two little people in blue and red color.
The only things you need to do is handling one of them, and pull the another one over the white line.
People will lost if he over the white line. Yes, thing is simple. As for those lose their head during the drastic progress of the game, we are not in charge of them...
As to the reason why they want to proceed this game, sorry, we don't know either.
If you really want me to say something about it, I image maybe it is only a game between a boss and his programmers who want to have a raise of his salary.
Two people actions is very funny, it can make you can't stop laugh.
Are you still arguing about who to wash the dishes?
No, it is enough. Save the failed relationship, save corrupted marriage. We launched a two players mode for those people who are difficult to choose something and OCD people.
Remove the dispute, solve your problem. We send you a carefree life without injection or medicine if you choose us!
Comparable Android apps
The five apps in Arcade with the closest revenue to Tug Table. Click any to see its detail page.
Each forecast combines App Store rating, ratings count, monetisation model, pricing tier, IAP signals and ad-supported flag.
The base estimate is then multiplied by a per-category scaling factor learned from apps with founder-verified MRR.
Every number on this page comes from public APIs and bumetric's own snapshot history.
Full methodology covers input variables, accuracy bands per category and how we treat apps without comparable anchors.
See also the live data on Tug Table's tracker page for current rating, reviews and snapshot timeline.
Building something similar? Get a free AI audit with $-revenue forecasts for every recommendation.

 McPixel Lite
 Food Court -Chef’s Restaurant
 Family Style
 Cubes Craft
 Ghosts VS Villagers