ML revenue forecast.
Calibrated against 77127 apps in this category.
Confidence band
±15%
High — many comparable apps with verified data
At a glance
Earns 3.19× more than the category median (177/mo).
Ranks #6,012 of 77,127 in Entertainment (top 7.8% by revenue).
Launched Nov 03, 2013 · last updated Apr 21, 2026.
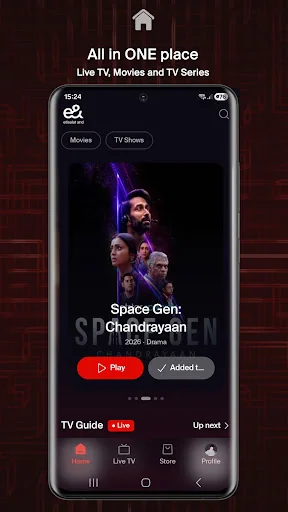
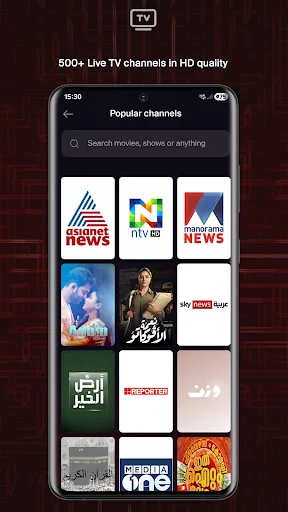
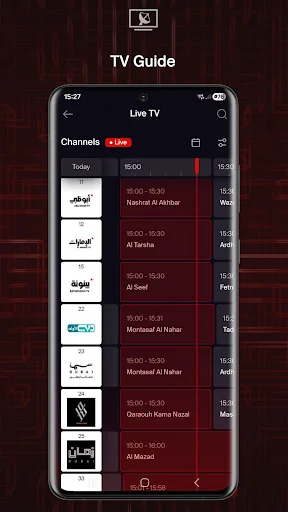
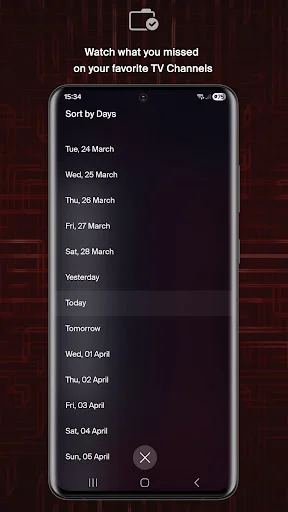
What the app looks like
Live screenshots from the Play Store, captured by our snapshot worker. Tap any image to enlarge.
TV by e&'s revenue trajectory
Forecast revenue from snapshot history. Last 1 months.
Where TV by e& sits in Entertainment
Revenue distribution of 77127 comparable apps. TV by e& highlighted.
TV by e& vs comparable apps
Revenue trajectory side-by-side. Bold = TV by e&, ghosted = peers.
App spec
Version
3.18
Last update
Apr 21, 2026
Launched
Nov 03, 2013
Price
Free
Monetization
Free
What TV by e& actually does (from store listing)
A brand new TV by e& App experience is here. This release is packed with new features and will make experiencing the #1 entertainment provider in the UAE even easier!
There are new ways to enjoy a massive lineup of TV channels as well as our premium On Demand movie library.
Never miss a moment, instantly record your favorite TV shows with one click or schedule a recording, no matter where you are.
Set reminders and TV by e& will let you know that your favorite show is starting or tha…
A brand new TV by e& App experience is here. This release is packed with new features and will make experiencing the #1 entertainment provider in the UAE even easier!
There are new ways to enjoy a massive lineup of TV channels as well as our premium On Demand movie library.
Never miss a moment, instantly record your favorite TV shows with one click or schedule a recording, no matter where you are.
Set reminders and TV by e& will let you know that your favorite show is starting or that your team is about to kick off.
Don’t worry if you forget to watch your show, TV by e& app is able to play shows that aired up to 7 days in the past!
With a massive catalogue of on demand TV series plus our unrivaled Movies On Demand catalogue we have you covered from – Bollywood, Hollywood, Arabic, Tagalog and our new TV by e& Originals.
Comparable Android apps
The five apps in Entertainment with the closest revenue to TV by e&. Click any to see its detail page.
Each forecast combines App Store rating, ratings count, monetisation model, pricing tier, IAP signals and ad-supported flag.
The base estimate is then multiplied by a per-category scaling factor learned from apps with founder-verified MRR.
Every number on this page comes from public APIs and bumetric's own snapshot history.
Full methodology covers input variables, accuracy bands per category and how we treat apps without comparable anchors.
See also the live data on TV by e&'s tracker page for current rating, reviews and snapshot timeline.
Building something similar? Get a free AI audit with $-revenue forecasts for every recommendation.

 TH FPV
 Blackboard Edutech
 Mahakal Status Mntra and puja
 Daily Quotes and Status
 Gif Stickers For Whatsapp