What UCLA Bruins actually does (from store listing)
UCLA Bruins in partnership with SIDEARM Sports is excited to bring you the official UCLA Bruins app that is a must-have for fans headed to campus or following the Bruins from afar. With interactive social media, and all the scores and stats surrounding the game, the UCLA Bruins app covers it all!
App Features:
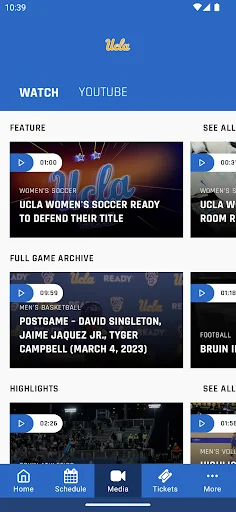
- Stats. Dig deeper while viewing live scoreboards, box scores and post game details on the schedule.
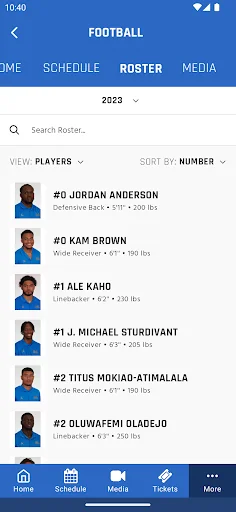
- Players. Check out the rosters and get to know your favorite players.
- Sche…
UCLA Bruins in partnership with SIDEARM Sports is excited to bring you the official UCLA Bruins app that is a must-have for fans headed to campus or following the Bruins from afar. With interactive social media, and all the scores and stats surrounding the game, the UCLA Bruins app covers it all!
App Features:
- Stats. Dig deeper while viewing live scoreboards, box scores and post game details on the schedule.
- Players. Check out the rosters and get to know your favorite players.
- Schedule. Complete schedule for all athletic events.
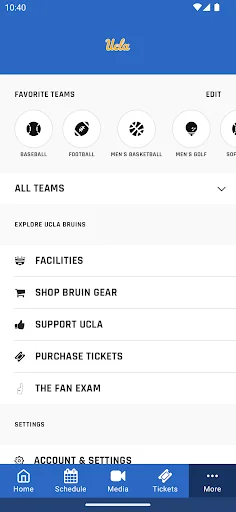
- View information on game days and facilities.
- Tickets. Buy tickets for upcoming home games.
- Fanzone. Participate in enter to win promotions, trivia and interactive fan polls.
- Purchase your favorite gear and other merchandise.
- Push Notifications (subscribe/unsubscribe in Settings).
#GoBruins
Comparable Android apps
The five apps in Sports with the closest revenue to UCLA Bruins. Click any to see its detail page.
Each forecast combines App Store rating, ratings count, monetisation model, pricing tier, IAP signals and ad-supported flag.
The base estimate is then multiplied by a per-category scaling factor learned from apps with founder-verified MRR.
Every number on this page comes from public APIs and bumetric's own snapshot history.
Full methodology covers input variables, accuracy bands per category and how we treat apps without comparable anchors.
See also the live data on UCLA Bruins's tracker page for current rating, reviews and snapshot timeline.
Building something similar? Get a free AI audit with $-revenue forecasts for every recommendation.


 Golf i Sverige
 SocialCorner Betis
 Italian Football Table
 Leisure.ly Badminton
 VirtualPro