Urent – e-scooter and bike share app. If you want to go for a ride with friends or get to your favourite coffee shop quickly and easily – Urent is a service for you! Fast and convenient way to move around the city, hundreds of parking lots where you can rent an electric scooter and leave it afterwards.
It’s simple!
- Download the app and register – it takes a couple of minutes, only a phone number and a bank card are needed.
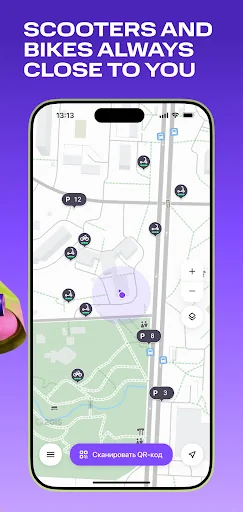
- Find the nearest e-scooter on the map in the app.
- Scan QR-c…
Urent – e-scooter and bike share app. If you want to go for a ride with friends or get to your favourite coffee shop quickly and easily – Urent is a service for you! Fast and convenient way to move around the city, hundreds of parking lots where you can rent an electric scooter and leave it afterwards.
It’s simple!
- Download the app and register – it takes a couple of minutes, only a phone number and a bank card are needed.
- Find the nearest e-scooter on the map in the app.
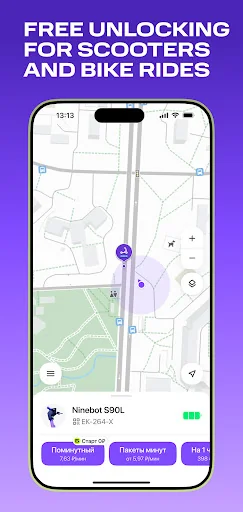
- Scan QR-code on the wheel, choose tariff plan and press "Start"
- Unlock the scooter, push off and press the gas – the lever on the right side of the wheel.
- Hundreds of parking lots to lock the scooter easily and finish the rent.
- Keep an eye on the charge of the scooter to find parking complete the rent in time.
MULTI-RENT
Take up to 5 scooters and/or bikes per one account – just rent a few e-scooters or bicycles by scanning their QR-codes.
BOOKING AND STANDBY MODE
Book a bike or electric scooter in the app, and it will wait for you for 10 minutes.
You can close the lock and put the e-scooter in standby mode during rental – rent continues, but the lock will be closed, you can leave for a few minutes without worrying about your scooter safety.
More information about service use terms on our website https://urent.ru/rules/
Service is available in Moscow, St. Petersburg, Kazan, Yekaterinburg, Novosibirsk and the largest cities in the South of Russia, such as Sochi, Krasnaya Polyana, Anapa, Krasnodar, Rostov-on-Don and others. The rental rules may differ for each city, so we recommend checking them before renting. In general, sharing is similar to Whoosh, Eleven, Lite, Busyfly, YES Sharing, Lime, Bird, Dott, Voi, Tier, Circ, EnerGo and others.
E-scooter and bike sharing Urent – simple, pleasant and fast way to get wherever you want!
Comparable Android apps
The five apps in Auto & Vehicles with the closest revenue to Urent. Click any to see its detail page.
Each forecast combines App Store rating, ratings count, monetisation model, pricing tier, IAP signals and ad-supported flag.
The base estimate is then multiplied by a per-category scaling factor learned from apps with founder-verified MRR.
Every number on this page comes from public APIs and bumetric's own snapshot history.
Full methodology covers input variables, accuracy bands per category and how we treat apps without comparable anchors.
See also the live data on Urent's tracker page for current rating, reviews and snapshot timeline.
Building something similar? Get a free AI audit with $-revenue forecasts for every recommendation.


 DoneDeal: Cars For Sale
 POV Car Driving
 Vehicle Plate Codes of Russia
 StarLine
 Simply Auto: Car Maintenance