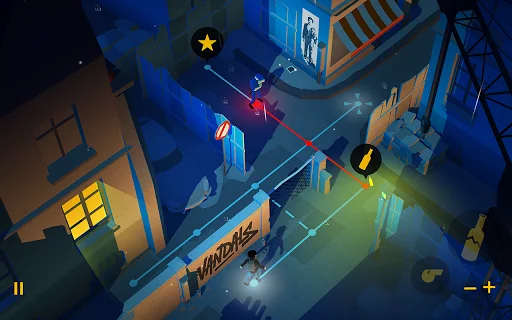
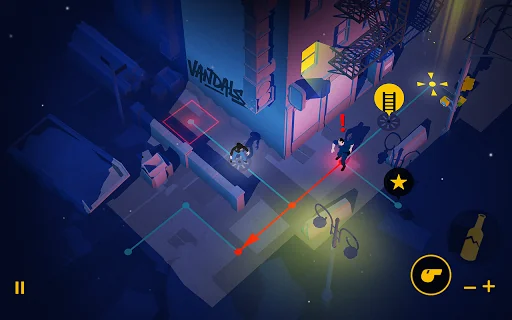
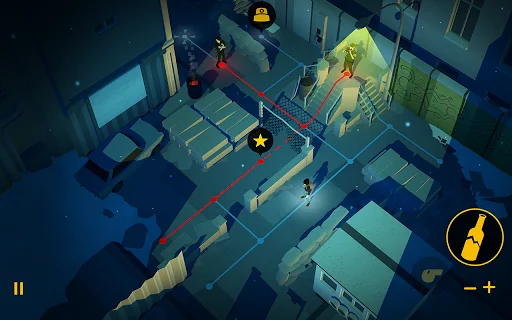
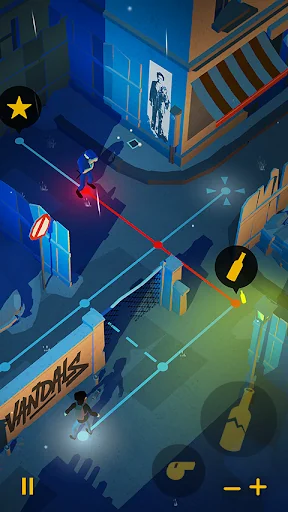
Vandals is an infiltration game that will transport you to the most emblematic cities of street art. In this turn-based game, the aim is to sneak around police surveillance and spray walls that grow harder and harder to access.
From Paris to Tokyo, via São Paulo, Berlin and New York, follow in the wake of ultra-famous street artists like Blek Le Rat and Keith Haring.
With Vandals, you can bomb your alias on the walls of New York like Lady Pink, paint childlike characters like Keith Haring,…
Vandals is an infiltration game that will transport you to the most emblematic cities of street art. In this turn-based game, the aim is to sneak around police surveillance and spray walls that grow harder and harder to access.
From Paris to Tokyo, via São Paulo, Berlin and New York, follow in the wake of ultra-famous street artists like Blek Le Rat and Keith Haring.
With Vandals, you can bomb your alias on the walls of New York like Lady Pink, paint childlike characters like Keith Haring, or get inspired by the poems of Miss.Tic and write your own.
After Type:Rider, Vandals is the new project by Cosmografik. It is a video game published and co-produced by ARTE - the European cultural TV and digital channel - and Ex Nihilo. It was developed in partnership with Novelab.
It is easy to learn, and the puzzles promise hours of immersion and pleasure.
• Share your most awesome creations on social networks
• Rock to the rhythm of an original soundtrack: headphones recommended!
• Play in portrait or landscape mode. Left-handed / right-handed option
The game includes:
• 60 puzzles to solve
• 5 cities with original graphical worlds
• 40 backgrounders on the evolution of street art since the 1960s
• 18 achievements to unlock
Comparable Android apps
The five apps in Puzzle with the closest revenue to Vandals. Click any to see its detail page.
Each forecast combines App Store rating, ratings count, monetisation model, pricing tier, IAP signals and ad-supported flag.
The base estimate is then multiplied by a per-category scaling factor learned from apps with founder-verified MRR.
Every number on this page comes from public APIs and bumetric's own snapshot history.
Full methodology covers input variables, accuracy bands per category and how we treat apps without comparable anchors.
See also the live data on Vandals's tracker page for current rating, reviews and snapshot timeline.
Building something similar? Get a free AI audit with $-revenue forecasts for every recommendation.
 Marble Legend
 Love Balls
 Block Puzzle - Wood Legend
 Sherlock Zen
 Color Water Sort Puzzle Games