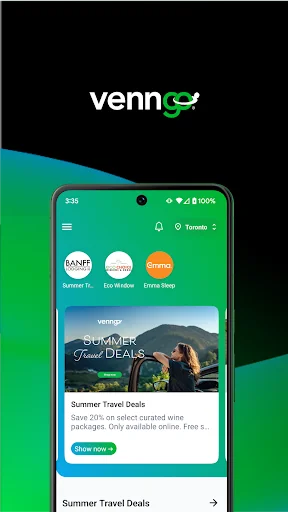
The Venngo app gives you access to your WorkPerks®, MemberPerks® or CustomerPerks® discounts while on the go. Save on everything from fashion and dining to travel and electronics with special offers from national brand names and local favourites without having to visit the website. We’re always adding perks, so make sure you check back regularly to see what new discounts are available.
With the Venngo app you can:
Register and sign in to your WorkPerks, MemberPerks or CustomerPerks accou…
The Venngo app gives you access to your WorkPerks®, MemberPerks® or CustomerPerks® discounts while on the go. Save on everything from fashion and dining to travel and electronics with special offers from national brand names and local favourites without having to visit the website. We’re always adding perks, so make sure you check back regularly to see what new discounts are available.
With the Venngo app you can:
Register and sign in to your WorkPerks, MemberPerks or CustomerPerks account
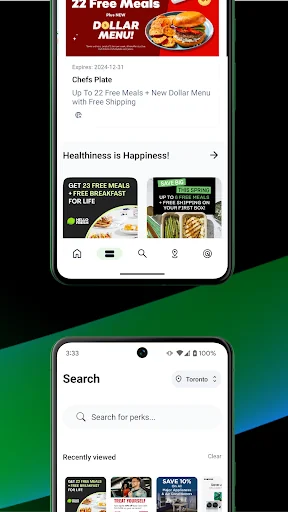
Browse and redeem your perks using your phone
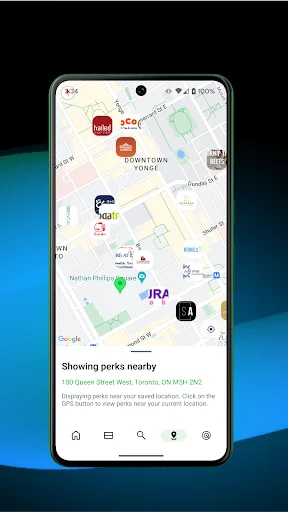
See the perks nearby using GPS
Invite family members to start saving
FOR MEMBERS ONLY
The Venngo app is exclusive to organizations that have registered for WorkPerks, MemberPerks or CustomerPerks. Please contact your organization or email support@venngo.com for assistance.
With the Venngo app you can:
• sign in to your workperks®, memberperks®, customerperks® or My Perks® Account
• browse and redeem your perks using your iPhone or iPad
• see the perks near you using your GPS
• mark perks as favourites
• track your savings
PLEASE NOTE: The Venngo app is only accessible to existing workperks®, memberperks®, customerperks® or My Perks® members
Comparable Android apps
The five apps in Shopping with the closest revenue to Venngo. Click any to see its detail page.
Each forecast combines App Store rating, ratings count, monetisation model, pricing tier, IAP signals and ad-supported flag.
The base estimate is then multiplied by a per-category scaling factor learned from apps with founder-verified MRR.
Every number on this page comes from public APIs and bumetric's own snapshot history.
Full methodology covers input variables, accuracy bands per category and how we treat apps without comparable anchors.
See also the live data on Venngo's tracker page for current rating, reviews and snapshot timeline.
Building something similar? Get a free AI audit with $-revenue forecasts for every recommendation.

 attrangs
 Бонусный клуб Меломан
 Blink Online
 UrukTech
 Clube Integrado e Clube Black