WHY IS FINE WINE A GOOD INVESTMENT?
Fine wine investment has delivered annual returns between 10%-14% over the last 30 years. The market is expected to grow +54% by 2024 reaching $7.8 billion. Not only is wine profitable, but it’s a relatively safe and stable way to diversify your investment portfolio.
HOW IT WORKS
Vindome gives you free access to hundreds of investment wines, En Primeur and hard-to-find releases. You have direct ownership of your wines that are stored in our professional b…
WHY IS FINE WINE A GOOD INVESTMENT?
Fine wine investment has delivered annual returns between 10%-14% over the last 30 years. The market is expected to grow +54% by 2024 reaching $7.8 billion. Not only is wine profitable, but it’s a relatively safe and stable way to diversify your investment portfolio.
HOW IT WORKS
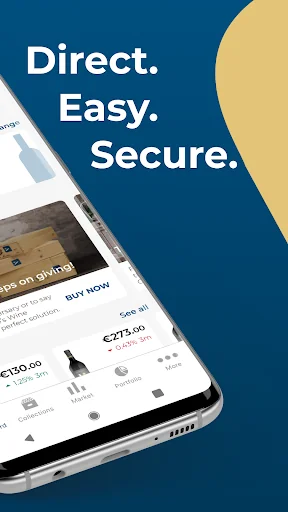
Vindome gives you free access to hundreds of investment wines, En Primeur and hard-to-find releases. You have direct ownership of your wines that are stored in our professional bonded VAT free warehouses and fully insured at market value. Trading your wines with thousands of other users on our platform is direct, easy and secure. You decide when to sell and make your profit! Smart, safe and secure is our motto. We guarantee the provenance of all wines by sourcing directly from the producers and négociants. All wine cases are sealed with an NFC tag detailing the case contents and trading information, thereby ensuring owner privacy All trades are recorded on blockchain, guaranteeing secure transactions.
LET'S GET YOU READY TO START INVESTING:
● Step 1: Download the app and register for free by using your preferred login or by entering your full name and email.
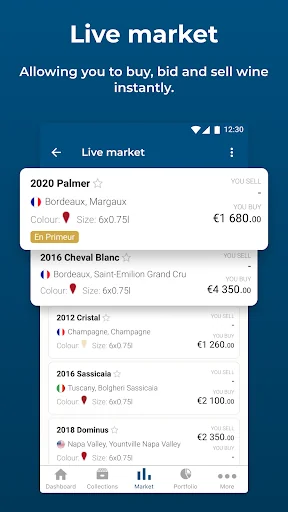
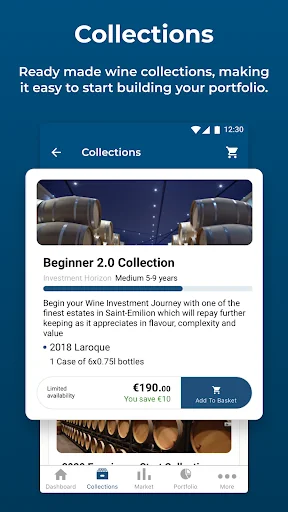
● Step 2: Buy wines. Browse our ready built Collections curated by our experts or find the wine you like on the Live Market, our real-time trading platform. Once you purchased a wine, it will be added directly to your portfolio.
● Step 3: Keep track of your portfolio performance. See your wine’s historical data and follow the latest trade price.
● Step 4: Make a profit by trading as a buyer or seller on our Live Market. Add your bank account details before start selling.
KEY FEATURES
Buy & sell fine wines
BUY: There are two ways to buy wine on the Vindome platform: Collections and Live Market.
SELL: Tap on the wine you wish to sell in your portfolio. This will open the investment details page where you then press the SELL button. You can then either match your sales price and number of units to an existing bid or create your own offer by entering the number of units and price you wish to sell at. The wine will be sold if another user matches your offer.
Method of payment
Vindome accepts all major credit and debit cards, PayPal and bank transfers.
Take confident portfolio decisions
Access detailed trading information about each wine including well known critics’ ratings. Use the extensive wine guide to deepen your knowledge of different wine regions and producers. Learn more about wine investment thanks to our tips. Receive push notifications on new investment opportunities.
Keep track of your portfolio performance
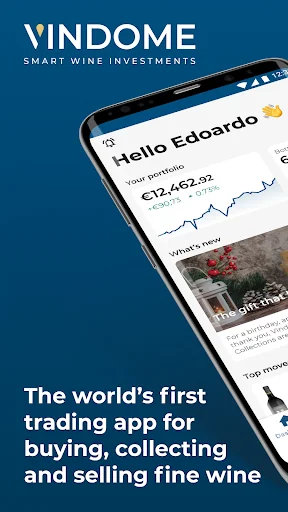
Follow your wine market performance, active bids & offers and your trading history in your portfolio. Your portfolio performance is shown in real time with historical data from Wine Decider and the latest trade price on our live market.
Store your wine
All wines on our platform are stored at constant, optimal temperatures in our professional facilities. Warehouses are strategically located close to each production region, reducing the need to move the cases. Your wine is fully insured at market value. A breakdown of the cost of storage and insurance is shown before you make the final payment. Storage is payable on a quarterly basis. Vindome can deliver purchased wines to the address of your choice.
Comparable Android apps
The five apps in Lifestyle with the closest revenue to Vindome. Click any to see its detail page.
Each forecast combines App Store rating, ratings count, monetisation model, pricing tier, IAP signals and ad-supported flag.
The base estimate is then multiplied by a per-category scaling factor learned from apps with founder-verified MRR.
Every number on this page comes from public APIs and bumetric's own snapshot history.
Full methodology covers input variables, accuracy bands per category and how we treat apps without comparable anchors.
See also the live data on Vindome's tracker page for current rating, reviews and snapshot timeline.
Building something similar? Get a free AI audit with $-revenue forecasts for every recommendation.


 New Hope Church Abilene
 CM Sensor
 Family Fellowship
 Choctaw County EMA AL
 Muslim Calendar Prayer Times