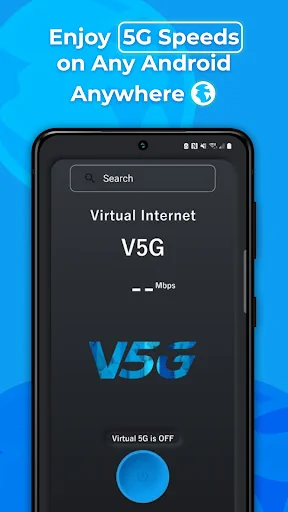
What Virtual 5G actually does (from store listing)
ADARA VIRTUAL 5G
Not just Bigger Bandwidth, ADARA Virtual 5G is Better Bandwidth, and Better Quality.
VIRTUAL5G:
GLOBAL COVERAGE
100% AVAILABLE
LESS EXPENSIVE
SECURE
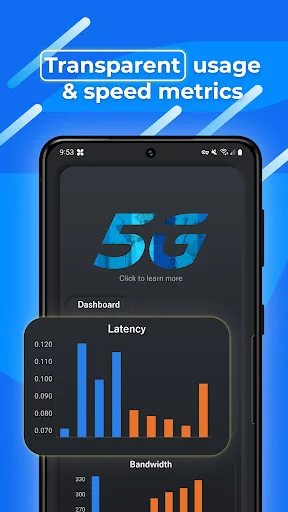
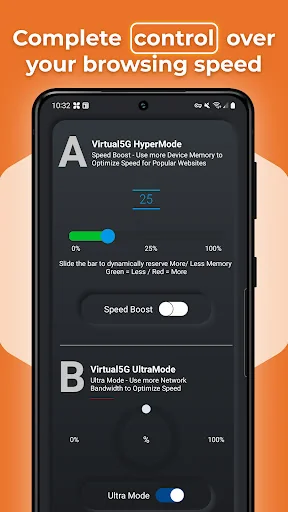
INCREASED PERFORMANCE
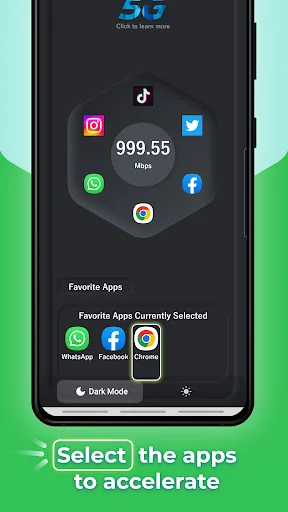
GREATER BANDWIDTH
PRIVATE
PRODUCTIVE
EASE OF USE
SAFE
VALUE
SUPPORTS ANDROID AUTO
WIFI/CELLULAR RADIO
VIRTUAL 5G: OPTIMIZED FOR LOWER BANDWIDTH LOSSY NETWORKS SUCH AS MOBILE DATA AND SATELLITE NETWORKS
User Disclosure:
Virtual 5G establishes a VPN…
ADARA VIRTUAL 5G
Not just Bigger Bandwidth, ADARA Virtual 5G is Better Bandwidth, and Better Quality.
VIRTUAL5G:
GLOBAL COVERAGE
100% AVAILABLE
LESS EXPENSIVE
SECURE
INCREASED PERFORMANCE
GREATER BANDWIDTH
PRIVATE
PRODUCTIVE
EASE OF USE
SAFE
VALUE
SUPPORTS ANDROID AUTO
WIFI/CELLULAR RADIO
VIRTUAL 5G: OPTIMIZED FOR LOWER BANDWIDTH LOSSY NETWORKS SUCH AS MOBILE DATA AND SATELLITE NETWORKS
User Disclosure:
Virtual 5G establishes a VPN Service and provides a VPN as part of its core functionality can create a secure device-level tunnel to a remote server.
The VPN Service is a base class for applications to extend and build their own VPN solutions.
Virtual 5G offers enhanced web browsing and connectivity among other benefits.
This User Disclosure is provided as Apps that use the VPN Service must document the use of the VPN Service in the Google Play listing.
Virtual 5G complies with these requirements.
End User Terms
By downloading and/or using this product, you acknowledge and agree to the end user license agreement and Privacy Policy Statement at:
Each forecast combines App Store rating, ratings count, monetisation model, pricing tier, IAP signals and ad-supported flag.
The base estimate is then multiplied by a per-category scaling factor learned from apps with founder-verified MRR.
Every number on this page comes from public APIs and bumetric's own snapshot history.
Full methodology covers input variables, accuracy bands per category and how we treat apps without comparable anchors.
See also the live data on Virtual 5G's tracker page for current rating, reviews and snapshot timeline.
Building something similar? Get a free AI audit with $-revenue forecasts for every recommendation.

 Fast gloo wall
 Cube Timer
 HyperIMU
 Latest Versions Update Info
 MATLAB Mobile