What W Box VMS1 actually does (from store listing)
Connecting with more secured world is our mission and you can get it here, the free video app that allows you to easily available anywhere, which supports the full line of our products that support standard H.264 video codec.
The key features of Application include:
*Decoding support H264 & H265
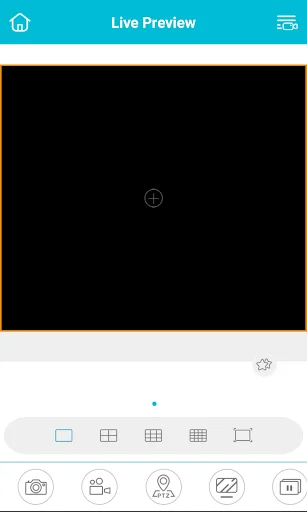
*Live video preview of 16 channels at least.
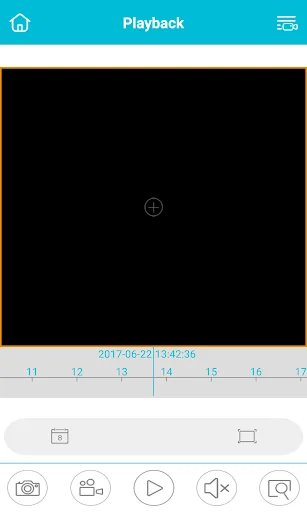
*Playback video preview of 1 channel.
*Management of the sets of devices info.
*Management of the sets of record videos and snapshot images.
*Suppor…
Connecting with more secured world is our mission and you can get it here, the free video app that allows you to easily available anywhere, which supports the full line of our products that support standard H.264 video codec.
The key features of Application include:
*Decoding support H264 & H265
*Live video preview of 16 channels at least.
*Playback video preview of 1 channel.
*Management of the sets of devices info.
*Management of the sets of record videos and snapshot images.
*Support for 21 languages if you want to switch.
*More and more functions you can find when in use.
Comparable Android apps
The five apps in Business with the closest revenue to W Box VMS1. Click any to see its detail page.
Each forecast combines App Store rating, ratings count, monetisation model, pricing tier, IAP signals and ad-supported flag.
The base estimate is then multiplied by a per-category scaling factor learned from apps with founder-verified MRR.
Every number on this page comes from public APIs and bumetric's own snapshot history.
Full methodology covers input variables, accuracy bands per category and how we treat apps without comparable anchors.
See also the live data on W Box VMS1's tracker page for current rating, reviews and snapshot timeline.
Building something similar? Get a free AI audit with $-revenue forecasts for every recommendation.


 iDirect Partner
 CMP
CMP
 SightCall
 Go Team
 RAC Benefits Plus