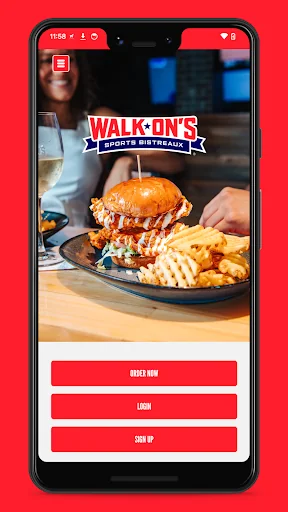
Get the full Walk-On’s experience at your fingertips with the Walk-On’s app!
Here’s what you can do:
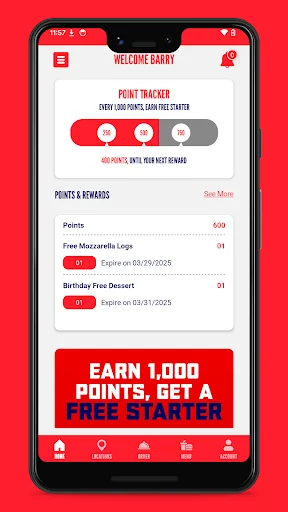
- Track Your Points: Earn 10 points for every $1 spent and keep tabs on your points balance.
- View and Redeem Rewards: Check out available rewards and use them directly from the app.
- Order Online: Place pickup or delivery orders with ease.
- Save Your Favorites: Quickly reorder your go-to dishes with saved favorite and recent orders.
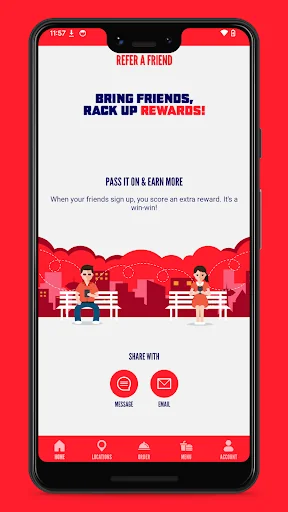
- Refer a Friend: Share the game-day love! Invite …
Get the full Walk-On’s experience at your fingertips with the Walk-On’s app!
Here’s what you can do:
- Track Your Points: Earn 10 points for every $1 spent and keep tabs on your points balance.
- View and Redeem Rewards: Check out available rewards and use them directly from the app.
- Order Online: Place pickup or delivery orders with ease.
- Save Your Favorites: Quickly reorder your go-to dishes with saved favorite and recent orders.
- Refer a Friend: Share the game-day love! Invite friends to join our loyalty program and earn rewards when they sign up.
- Buy eGift Cards: Send the perfect gift right from the app.
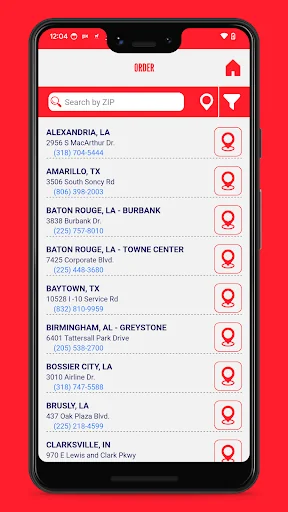
- Locate a Walk-On’s Near You: Find your closest Walk-On’s location and get directions.
- Manage Your Account: Update your profile, preferences, and communication settings.
The Walk-On’s app makes it easy to stay connected and get rewarded every time you order. Download today to start earning points and enjoying the perks of being a Walk-On’s fan!
Comparable Android apps
The five apps in Food & Drink with the closest revenue to Walk-On's. Click any to see its detail page.
Each forecast combines App Store rating, ratings count, monetisation model, pricing tier, IAP signals and ad-supported flag.
The base estimate is then multiplied by a per-category scaling factor learned from apps with founder-verified MRR.
Every number on this page comes from public APIs and bumetric's own snapshot history.
Full methodology covers input variables, accuracy bands per category and how we treat apps without comparable anchors.
See also the live data on Walk-On's's tracker page for current rating, reviews and snapshot timeline.
Building something similar? Get a free AI audit with $-revenue forecasts for every recommendation.

 nosh - Reduce food waste
 LA Piadineria
 Stew Leonard's Loyalty App
 Hungry Birds
 클럽아티제 - 아티제 멤버십