Unlock the power of your Wallbox charger with the myWallbox app! myWallbox is your hub for our smart charging and energy management solutions and is compatible with all Wallbox electrical vehicle chargers. Connect to Wallbox chargers at home, work or at charging points on-the-go.
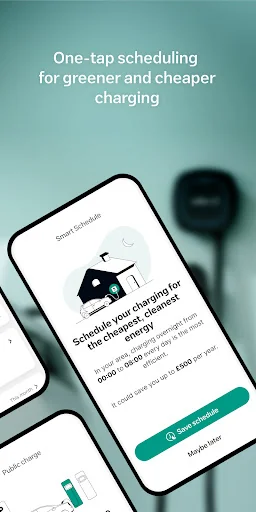
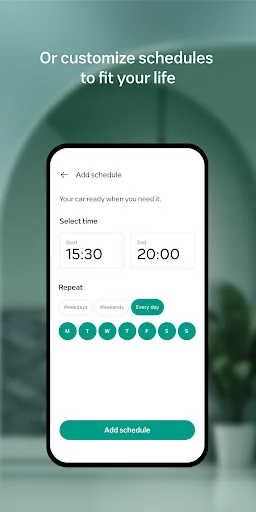
- Save money by setting charging schedules that take advantage of off-peak rates
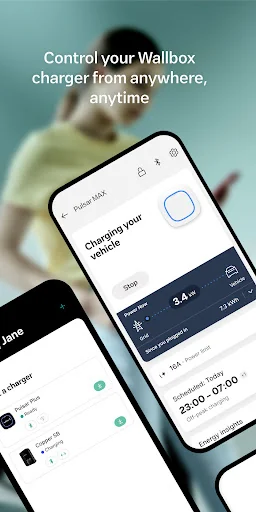
- Control and monitor your EV charging status from anywhere
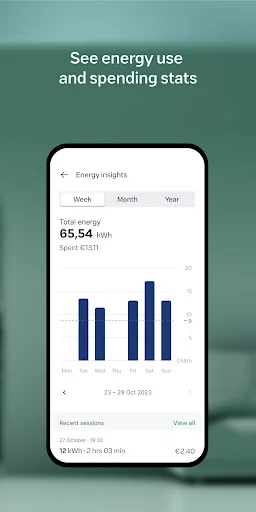
- Track your energy consumption and spending
- Avoid unwanted use with r…
Unlock the power of your Wallbox charger with the myWallbox app! myWallbox is your hub for our smart charging and energy management solutions and is compatible with all Wallbox electrical vehicle chargers. Connect to Wallbox chargers at home, work or at charging points on-the-go.
- Save money by setting charging schedules that take advantage of off-peak rates
- Control and monitor your EV charging status from anywhere
- Track your energy consumption and spending
- Avoid unwanted use with remote lock and unlock
- Enable advanced environmentally-friendly energy management features like solar EV charging and dynamic load balancing
- Access payment options to charge at locations that offer Wallbox charging
Comparable Android apps
The five apps in Auto & Vehicles with the closest revenue to Wallbox. Click any to see its detail page.
Each forecast combines App Store rating, ratings count, monetisation model, pricing tier, IAP signals and ad-supported flag.
The base estimate is then multiplied by a per-category scaling factor learned from apps with founder-verified MRR.
Every number on this page comes from public APIs and bumetric's own snapshot history.
Full methodology covers input variables, accuracy bands per category and how we treat apps without comparable anchors.
See also the live data on Wallbox's tracker page for current rating, reviews and snapshot timeline.
Building something similar? Get a free AI audit with $-revenue forecasts for every recommendation.

 Заказ такси Измаил +
 Product Selector
 Trace Root
 Easy Dashcam App
 Offroad US Army Bus Transport