ML revenue forecast.
Calibrated against 48160 apps in this category.
Confidence band
±15%
High — many comparable apps with verified data
At a glance
Earns 1.65× more than the category median (130/mo).
Ranks #8,884 of 48,160 in Business (top 18.4% by revenue).
Launched Feb 08, 2021 · last updated May 05, 2026.
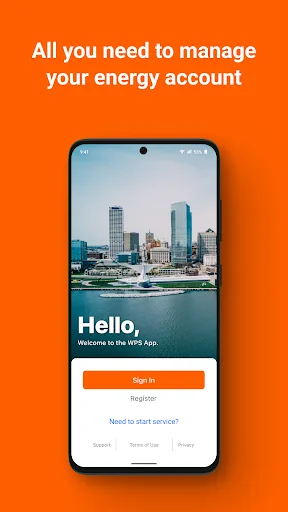
What the app looks like
Live screenshots from the Play Store, captured by our snapshot worker. Tap any image to enlarge.
We Energies's revenue trajectory
Forecast revenue from snapshot history. Last 1 months.
Where We Energies sits in Business
Revenue distribution of 48160 comparable apps. We Energies highlighted.
We Energies vs comparable apps
Revenue trajectory side-by-side. Bold = We Energies, ghosted = peers.
App spec
Version
2.19.0
Last update
May 05, 2026
Launched
Feb 08, 2021
Price
Free
Monetization
Free
What We Energies actually does (from store listing)
<b>Introducing the We Energies app that puts you in control. Anytime. Anywhere.</b>
Our new app gives you the power to get customized alerts, view and manage your account, pay bills quickly and much more – from anywhere. You asked. We delivered.
<b>Key features:</b>
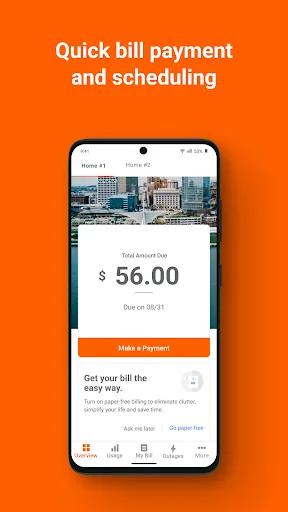
<b>Quick payment</b>
Pay your bill fast and easy.
<b>Scheduled payment</b>
Set it and forget it. You choose the date and payment method.
<b>Custom billing and payment alerts</b>
Receive alerts when your bill i…
Introducing the We Energies app that puts you in control. Anytime. Anywhere.
Our new app gives you the power to get customized alerts, view and manage your account, pay bills quickly and much more – from anywhere. You asked. We delivered.
Key features:
Quick payment Pay your bill fast and easy.
Scheduled payment Set it and forget it. You choose the date and payment method.
Custom billing and payment alerts Receive alerts when your bill is due and when payment is received. Never miss a payment.
Dollar limit alert Get notified when your energy charges reach the dollar limit amount you set.
Program sign up Sign up for payment and billing programs such as Automatic Payment and Budget Billing.
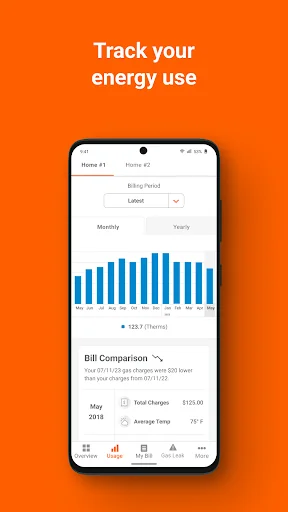
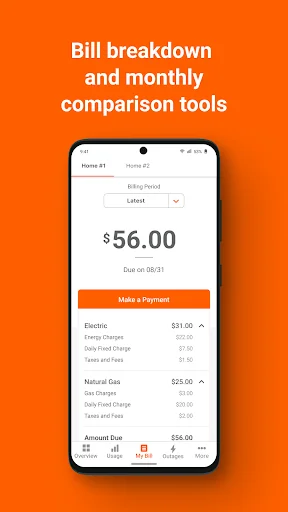
Bill analyzer View your current bill breakdown and your bill history.
Report an outage Quickly report a power outage in your area.
Outage notifications Know the estimated restoration time, cause and number of customers affected in real time.
Interactive outage map View the outage map to see currently affected areas.
Update account preferences Change or update your personal account information in seconds.
Access all accounts Find all your energy accounts in one place.
Comparable Android apps
The five apps in Business with the closest revenue to We Energies. Click any to see its detail page.
Each forecast combines App Store rating, ratings count, monetisation model, pricing tier, IAP signals and ad-supported flag.
The base estimate is then multiplied by a per-category scaling factor learned from apps with founder-verified MRR.
Every number on this page comes from public APIs and bumetric's own snapshot history.
Full methodology covers input variables, accuracy bands per category and how we treat apps without comparable anchors.
See also the live data on We Energies's tracker page for current rating, reviews and snapshot timeline.
Building something similar? Get a free AI audit with $-revenue forecasts for every recommendation.

 KOC , Kuwait Oil Company
 Slice of PE
 Travelpayouts
 Senoko Energy
 FlowHCM A complete HR solution