This is official app for Lighthouse Learning, Powered by SchoolDiary.
Now be a part of your child’s schooling with Lighthouse Learning WebGenie Mobile App. Loaded with exciting features the App helps you access messages, circulars, assignments, event calendars and the latest happening at the school. The WebGenie App helps you STAY CONNECTED and STAY UPDATED with multiple aspects of your child’s schooling and offers you the ease of having a seamless communication with the school and parent of ot…
This is official app for Lighthouse Learning, Powered by SchoolDiary.
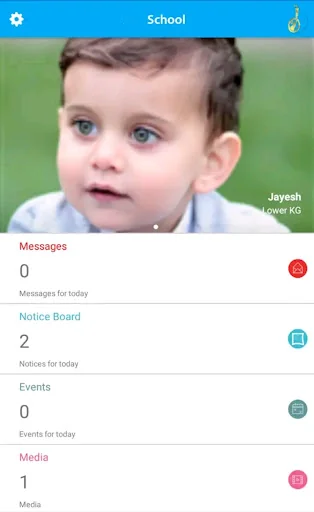
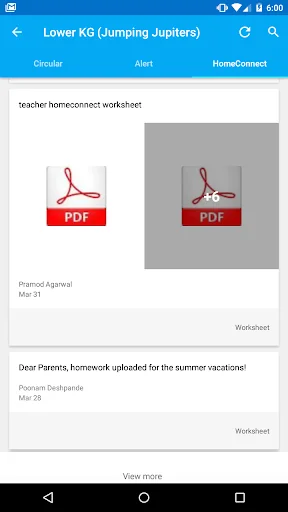
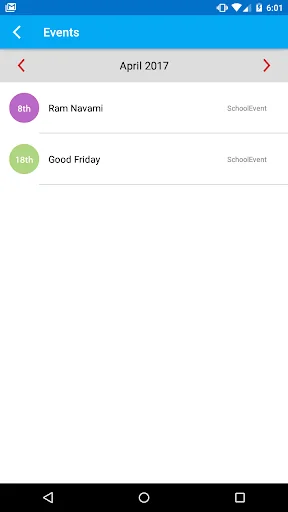
Now be a part of your child’s schooling with Lighthouse Learning WebGenie Mobile App. Loaded with exciting features the App helps you access messages, circulars, assignments, event calendars and the latest happening at the school. The WebGenie App helps you STAY CONNECTED and STAY UPDATED with multiple aspects of your child’s schooling and offers you the ease of having a seamless communication with the school and parent of other children.
So download the Lighthouse Learning WebGenie App to stay connected with Lighthouse Learning - anywhere, anytime!
Comparable Android apps
The five apps in Communication with the closest revenue to WebGenie. Click any to see its detail page.
Each forecast combines App Store rating, ratings count, monetisation model, pricing tier, IAP signals and ad-supported flag.
The base estimate is then multiplied by a per-category scaling factor learned from apps with founder-verified MRR.
Every number on this page comes from public APIs and bumetric's own snapshot history.
Full methodology covers input variables, accuracy bands per category and how we treat apps without comparable anchors.
See also the live data on WebGenie's tracker page for current rating, reviews and snapshot timeline.
Building something similar? Get a free AI audit with $-revenue forecasts for every recommendation.

 Walkietooth
 notes launcher (lotus notes)
 Brave Nightly
 Zadarma
 Caller ID & Speaker