What What's covered actually does (from store listing)
Finding information about Medicare coverage is easier than ever now. Download the only official U.S. government Medicare app onto your mobile device.
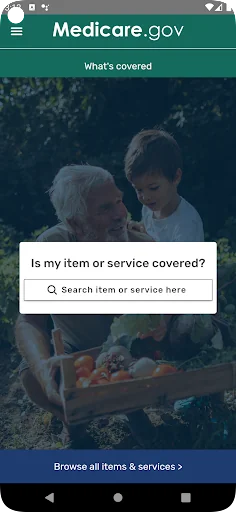
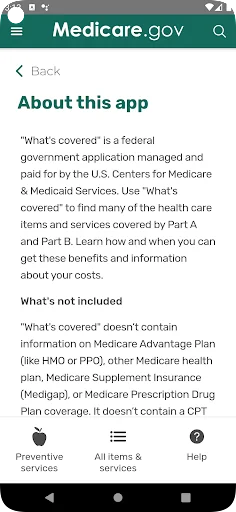
What’s covered helps you understand the health care coverage offered by Original Medicare Part A (Hospital Insurance) and Part B (Medical Insurance).
Use this federal government app to:
-Answer your Medicare coverage questions
-See information about your costs
-Learn about covered items & services
-See notes & where to get more in…
Finding information about Medicare coverage is easier than ever now. Download the only official U.S. government Medicare app onto your mobile device.
What’s covered helps you understand the health care coverage offered by Original Medicare Part A (Hospital Insurance) and Part B (Medical Insurance).
Use this federal government app to:
-Answer your Medicare coverage questions
-See information about your costs
-Learn about covered items & services
-See notes & where to get more information
-Browse free preventive services
Original Medicare Items & Services
Find out what your Medicare coverage has to offer like:
- When are mammograms covered?
- Is home health care covered?
- Will Medicare pay for diabetes supplies?
Preventive Health Coverage
Medicare coverage includes preventive services at no cost to you. Preventive services can help keep you healthy by finding health problems early and can keep you from getting certain diseases.
What’s covered will help you answer questions like:
- Will my Medicare benefits cover services to help me stop smoking?
- Can I get a cervical cancer screening?
- How often will my Medicare coverage allow me to get a bone mass measurement?
Ask your doctor or health care provider which preventive services (like screenings, shots, and tests) you need to get.
Part A & Part B Costs
Medicare Part A and Part B cover certain medical services and supplies in hospitals, doctors’ offices, and other health care settings.
Part A hospital insurance coverage helps pay for inpatient care in a hospital, inpatient care in a skilled nursing facility, hospice care, home health care, or inpatient care in a religious nonmedical health care institution. Copayments, coinsurance, or deductibles may apply for each service.
Part B medical insurance coverage supports medically necessary doctors’ services, outpatient care, home health services, durable medical equipment, preventive services, and other medical services. Under Original Medicare, if the Part B deductible applies, you must pay all health care costs (up to the Medicare-approved amount) until you meet the yearly Part B deductible. After your deductible is met, Medicare begins to pay its share and you typically pay 20% of the Medicare-approved amount of the service, if the doctor or health care provider accepts assignment. There’s no yearly limit for what you pay out-of-pocket.
For some items and services, you must meet eligibility criteria or you may be responsible for paying all costs. Your doctor or health care provider may recommend you get services more often than Medicare covers. Or, they may recommend services that Medicare doesn’t cover. If this happens, you may have to pay some or all of the costs. Ask questions so you understand why your doctor is recommending certain services and whether Medicare will pay for them.
Use the What’s covered app to answer questions like:
-How much will I pay for prescription drugs included in Medicare Part B coverage?
-Does the Part B deductible apply for cardiac rehab?
-What percentage of the Medicare-approved amount will I need to pay for colorectal cancer screenings?
What’s Not Included
What’s covered doesn’t contain information on Medicare Advantage Plan, other Medicare health plan, or Medicare Supplement Insurance (Medigap) coverage. It doesn’t contain a CPT code search, exact costs on surgeries or procedures, or local coverage decisions.
Medicare Advantage Plans
If you have a Medicare Advantage Plan or other Medicare health plan, you have the same basic health care coverage as people who have Original Medicare, but the rules vary by plan. Some Medicare Advantage Plans offer extra benefits that Original Medicare doesn’t cover - like vision, hearing, or dental. Check with the plan or search in the App or Google Play Store to see if the plan has a similar mobile application.
This is Medicare’s first official app, and we value your feedback. Please tell us your thoughts by rating What’s covered.
Comparable Android apps
The five apps in Medical with the closest revenue to What's covered. Click any to see its detail page.
Each forecast combines App Store rating, ratings count, monetisation model, pricing tier, IAP signals and ad-supported flag.
The base estimate is then multiplied by a per-category scaling factor learned from apps with founder-verified MRR.
Every number on this page comes from public APIs and bumetric's own snapshot history.
Full methodology covers input variables, accuracy bands per category and how we treat apps without comparable anchors.
See also the live data on What's covered's tracker page for current rating, reviews and snapshot timeline.
Building something similar? Get a free AI audit with $-revenue forecasts for every recommendation.

 닥터나우 - 1위 비대면진료 앱, 전화진료, 약국찾기
 OneShot UKMPPD: Latihan Soal
 ListMeds
 vimedi
 Doctor dictionary