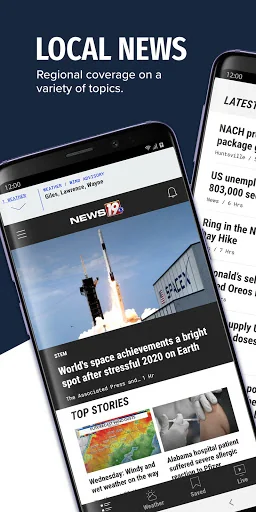
Livestreaming, breaking news notifications, and all the local news you want from WHNT in a fast, high-performance app.
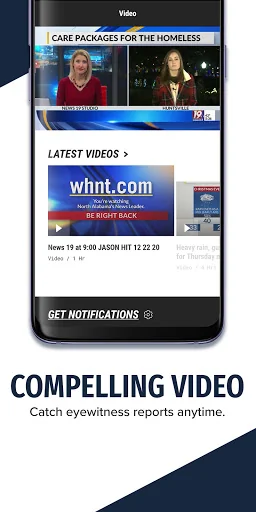
Watch and read stories at the same time -- the video plays as you scroll. Be the first to know with breaking news alerts, and find out what's happening in your area with News Near Me.
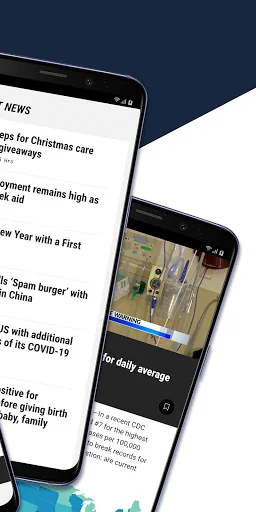
Never miss any WHNT news - you can livestream our newscasts right from your phone or tablet. Save stories to read later, and share easily to Facebook, Twitter, and other social networks. …
Livestreaming, breaking news notifications, and all the local news you want from WHNT in a fast, high-performance app.
Watch and read stories at the same time -- the video plays as you scroll. Be the first to know with breaking news alerts, and find out what's happening in your area with News Near Me.
Never miss any WHNT news - you can livestream our newscasts right from your phone or tablet. Save stories to read later, and share easily to Facebook, Twitter, and other social networks.
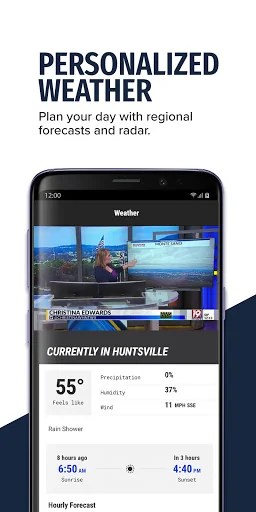
Get a head start on your day with WHNT traffic and weather maps. Enter our latest contests and promotions right from your phone, and catch up on all your favorite segments from WHNT.
Please note: This app features Nielsen’s proprietary measurement software which contributes to market research, like Nielsen’s TV Ratings. Please see http://priv-policy.imrworldwide.com/priv/mobile/us/en/optout.html for more information.
Comparable Android apps
The five apps in News & Magazines with the closest revenue to WHNT. Click any to see its detail page.
Each forecast combines App Store rating, ratings count, monetisation model, pricing tier, IAP signals and ad-supported flag.
The base estimate is then multiplied by a per-category scaling factor learned from apps with founder-verified MRR.
Every number on this page comes from public APIs and bumetric's own snapshot history.
Full methodology covers input variables, accuracy bands per category and how we treat apps without comparable anchors.
See also the live data on WHNT's tracker page for current rating, reviews and snapshot timeline.
Building something similar? Get a free AI audit with $-revenue forecasts for every recommendation.

 India Today Magazine Hindi
 Prime pagine
 WPBF 25 News and Weather
 Correio do Povo
 New World TV