ML revenue forecast.
Calibrated against 24344 apps in this category.
Confidence band
±15%
High — many comparable apps with verified data
At a glance
Earns 2.38× more than the category median (178/mo).
Ranks #3,134 of 24,344 in News & Magazines (top 12.9% by revenue).
Launched Jan 16, 2013 · last updated May 20, 2026.
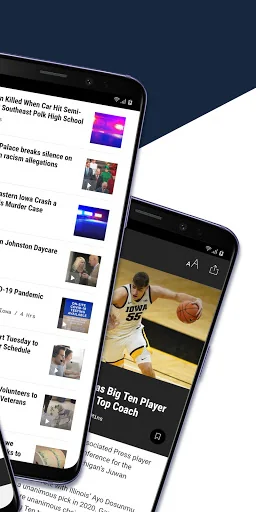
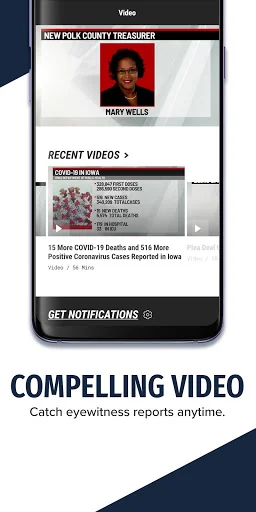
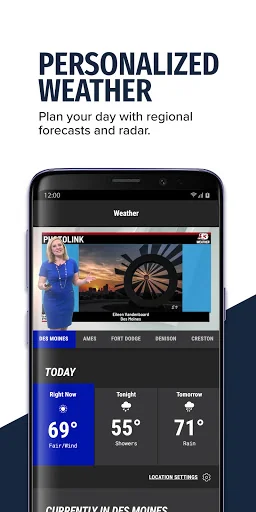
What the app looks like
Live screenshots from the Play Store, captured by our snapshot worker. Tap any image to enlarge.
WHO 13's revenue trajectory
Forecast revenue from snapshot history. Last 1 months.
Where WHO 13 sits in News & Magazines
Revenue distribution of 24344 comparable apps. WHO 13 highlighted.
WHO 13 vs comparable apps
Revenue trajectory side-by-side. Bold = WHO 13, ghosted = peers.
App spec
Version
508.0.0
Last update
May 20, 2026
Launched
Jan 16, 2013
Price
Free
Monetization
Free
What WHO 13 actually does (from store listing)
News has never been more local than in the palm of your hand. The WHO 13 mobile app brings you all the top stories from our daily broadcasts, as well as stories developing in real time.
Stay informed, stay safe and stay alert with the WHO 13 app! Livestreaming newscasts, breaking news and all of the news, politics, weather and sports that Central Iowa depends on can be found in one place. Watch every newscast and Hello Iowa! live on your phone or tablet. Know what the weather has in store w…
News has never been more local than in the palm of your hand. The WHO 13 mobile app brings you all the top stories from our daily broadcasts, as well as stories developing in real time.
Stay informed, stay safe and stay alert with the WHO 13 app! Livestreaming newscasts, breaking news and all of the news, politics, weather and sports that Central Iowa depends on can be found in one place. Watch every newscast and Hello Iowa! live on your phone or tablet. Know what the weather has in store with our updated forecasts and live Mega Doppler-S radar. Stay informed with the latest news and sports headlines from across the state.
FEATURES:
• Watch video of your trusted reporters on the scene, and read revealing articles on what's going on in your community.
• Plan your day and week with detailed weather reports, live alerts of severe conditions, and an interactive radar map.
• Optional alerts on breaking news keep you in the know.
• On the go? Save stories for later to access at your convenience.
Comparable Android apps
The five apps in News & Magazines with the closest revenue to WHO 13. Click any to see its detail page.
Each forecast combines App Store rating, ratings count, monetisation model, pricing tier, IAP signals and ad-supported flag.
The base estimate is then multiplied by a per-category scaling factor learned from apps with founder-verified MRR.
Every number on this page comes from public APIs and bumetric's own snapshot history.
Full methodology covers input variables, accuracy bands per category and how we treat apps without comparable anchors.
See also the live data on WHO 13's tracker page for current rating, reviews and snapshot timeline.
Building something similar? Get a free AI audit with $-revenue forecasts for every recommendation.


 ABC Nyheter
 Mintil Kerala Jobs
 Deunoposte Original
 Michigan Sports XTRA
 Het Belang van Limburg - Krant