What Wifi Heat Map - Survey actually does (from store listing)
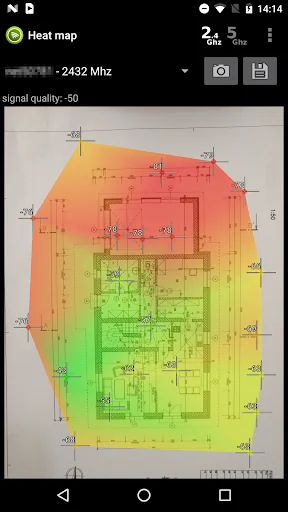
WiFi Heat Map helps you visualize wireless signal strength across any space — your home, office, warehouse, or shop.
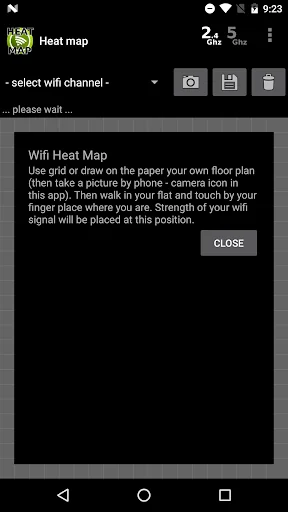
How it works:
1. Upload a floor plan image or take a photo of your layout
2. Select which WiFi networks to measure
3. Walk around and hold your finger on each position
4. Watch the heatmap build in real time
Key features:
• Live heatmap visualization during measurement
• Track multiple WiFi networks simultaneously
• Project detail with per-network signal previews
• E…
WiFi Heat Map helps you visualize wireless signal strength across any space — your home, office, warehouse, or shop.
How it works:
1. Upload a floor plan image or take a photo of your layout
2. Select which WiFi networks to measure
3. Walk around and hold your finger on each position
4. Watch the heatmap build in real time
Key features:
• Live heatmap visualization during measurement
• Track multiple WiFi networks simultaneously
• Project detail with per-network signal previews
• Export heatmaps as PNG images or CSV data
• Pinch to zoom, drag to navigate your floor plan
• Undo measurements, rotate floor plan
• Customizable marker size and edge glow effect
• Built-in help guide
• No account required, no data collected
• Works completely offline after WiFi scan
Find and fix WiFi dead zones:
See exactly where your signal is strong and where it drops. Compare coverage of different access points side by side. Use the data to optimally position your
routers and repeaters.
Privacy:
This app requires location permission solely because Android requires it for WiFi scanning (since Android 6.0). The app does not track, store, or transmit your
location. Full explanation is provided within the app.
Note on scan speed:
Android limits WiFi scans to 4 per 2 minutes. You can disable this in Developer Options for faster measurements. Instructions are included in the app settings.
Each forecast combines App Store rating, ratings count, monetisation model, pricing tier, IAP signals and ad-supported flag.
The base estimate is then multiplied by a per-category scaling factor learned from apps with founder-verified MRR.
Every number on this page comes from public APIs and bumetric's own snapshot history.
Full methodology covers input variables, accuracy bands per category and how we treat apps without comparable anchors.
See also the live data on Wifi Heat Map - Survey's tracker page for current rating, reviews and snapshot timeline.
Building something similar? Get a free AI audit with $-revenue forecasts for every recommendation.

 TCL TV Remote
 Intelius Background Check Pro
 Greyscale
 simple compass
 VPN Proxy Browser - Secure VPN