What win by inwi actually does (from store listing)
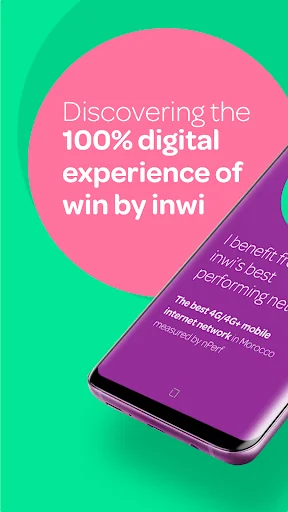
Win by inwi is the 100% digital mobile plan from inwi that offers you the max of 4G internet starting from 49Dh/month through a 100% online experience.
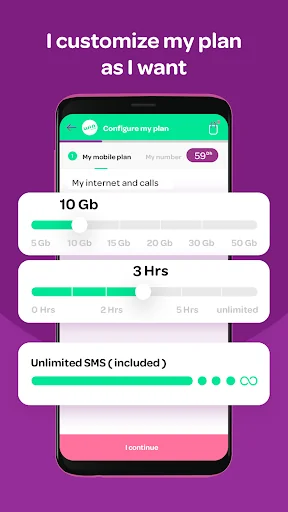
You customize your mobile plan by choosing the volume of internet and calls you want. You can stop & resume and modify your win plan whenever you want!
The win mobile plan is:
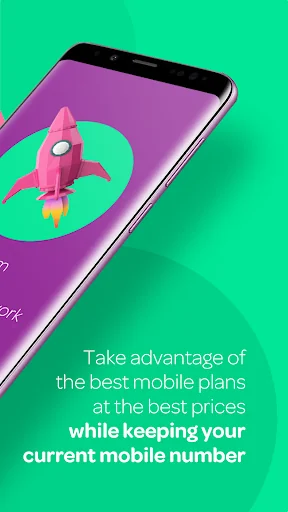
- The max of generosity: take advantage of the maximum of internet at the best prices
- No commissioning fees: you don't pay the line opening fees
- Maximum Flexibil…
Win by inwi is the 100% digital mobile plan from inwi that offers you the max of 4G internet starting from 49Dh/month through a 100% online experience.
You customize your mobile plan by choosing the volume of internet and calls you want. You can stop & resume and modify your win plan whenever you want!
The win mobile plan is:
- The max of generosity: take advantage of the maximum of internet at the best prices
- No commissioning fees: you don't pay the line opening fees
- Maximum Flexibility: customize your plan when you subscribe and change it every month if you need by choosing the volume of internet and calls. You can also add Gb and / or hours at any time regardless of the plan you chose at the start of the month, it's up to you!
- Non-binding in every sense of the word: start, stop and resume your plan when you want
- Free home delivery: order online and receive your SIM card at home, or use any inwi SIM card
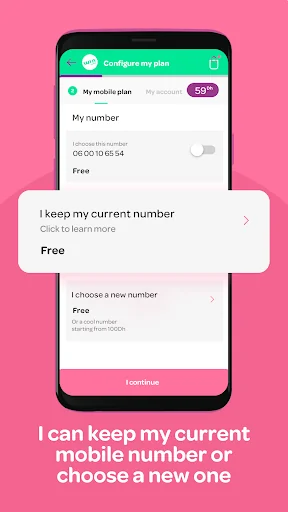
- Phone number : You can either keep your current phone number or choose a new one
With win, everything is done online on the win.ma website or the win by inwi mobile application (subscription, payment, modification, management of your 100% online plan)
o You subscribe: you customize your offer, choose your number, create your account online on win.ma or on the win by inwi mobile app, choose your delivery address and pay
o You monitor your data and calls consumption
o You pay your mobile plan and buy your passes with your bank card, on your bank's website or mobile app or using inwi money, inwi's electronic wallet
o You modify your plan
o You have access to the FAQ and winbot 24/7 and as a customer you can chat with our advisers 7/7 from 8h to 22h - no need for calls to customer service, everything is online! You can also contact us in a private message on social networks
For any privacy inquiries, contact us at suividedemande@win.ma
Comparable Android apps
The five apps in Tools with the closest revenue to win by inwi. Click any to see its detail page.
Each forecast combines App Store rating, ratings count, monetisation model, pricing tier, IAP signals and ad-supported flag.
The base estimate is then multiplied by a per-category scaling factor learned from apps with founder-verified MRR.
Every number on this page comes from public APIs and bumetric's own snapshot history.
Full methodology covers input variables, accuracy bands per category and how we treat apps without comparable anchors.
See also the live data on win by inwi's tracker page for current rating, reviews and snapshot timeline.
Building something similar? Get a free AI audit with $-revenue forecasts for every recommendation.
 Ice Box - Apps freezer
 Sim Serial Number ( ICCID)
 Google Cloud
 ToolBox
 FREE2GO