What WJAR Radar actually does (from store listing)
WJAR and Storm Team 10 is proud to announce a full featured weather app for the Android platform.
Features
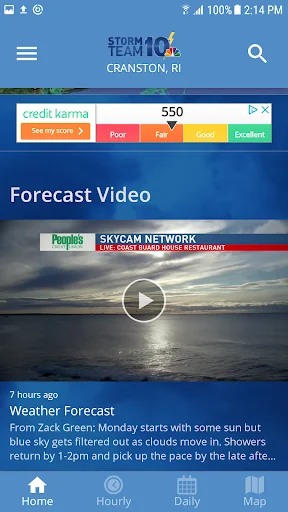
• Access to station content specifically for our mobile users
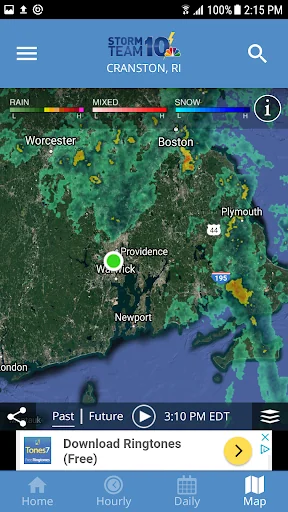
• 250 meter radar, the highest resolution available
• Future radar to see where severe weather is headed
• High resolution satellite cloud imagery
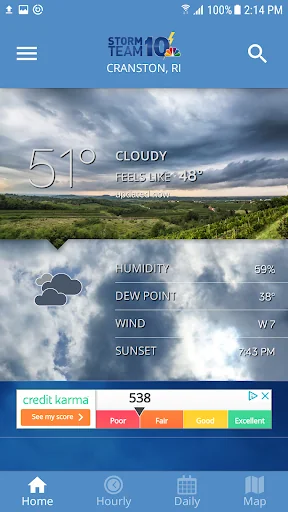
• Current weather updated multiple times per hour
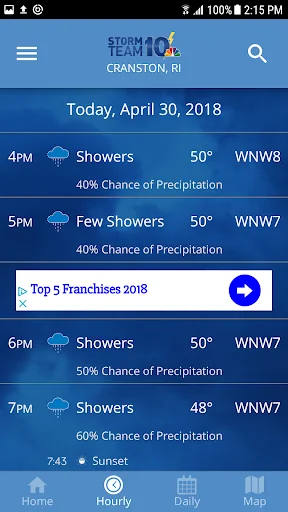
• Daily and Hourly forecasts updated hourly from our computer models
• Ability to add and save your f…
WJAR and Storm Team 10 is proud to announce a full featured weather app for the Android platform.
Features
• Access to station content specifically for our mobile users
• 250 meter radar, the highest resolution available
• Future radar to see where severe weather is headed
• High resolution satellite cloud imagery
• Current weather updated multiple times per hour
• Daily and Hourly forecasts updated hourly from our computer models
• Ability to add and save your favorite locations
• A fully integrated GPS for current location awareness
• Severe weather alerts from the National Weather Service
• Opt-in push alerts to keep you safe in severe weather
Comparable Android apps
The five apps in Weather with the closest revenue to WJAR Radar. Click any to see its detail page.
Each forecast combines App Store rating, ratings count, monetisation model, pricing tier, IAP signals and ad-supported flag.
The base estimate is then multiplied by a per-category scaling factor learned from apps with founder-verified MRR.
Every number on this page comes from public APIs and bumetric's own snapshot history.
Full methodology covers input variables, accuracy bands per category and how we treat apps without comparable anchors.
See also the live data on WJAR Radar's tracker page for current rating, reviews and snapshot timeline.
Building something similar? Get a free AI audit with $-revenue forecasts for every recommendation.

 UtahAir
 FOX 17 Weather – West Michigan
 City Road Bridge Construction
 Storm Guard - Weather Radar
 WRBL Weather