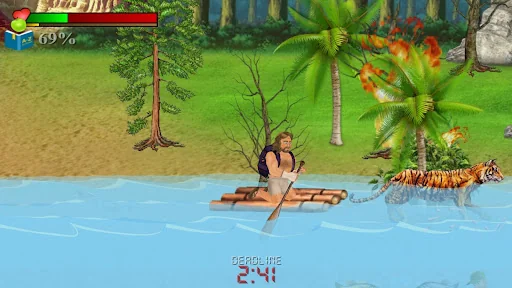
See how long you can survive on an island full of wildlife - and even wilder people! Compete for resouces with a new 2-handed control system that doubles the ways you can interact with the world around you - putting the power to create or destroy in your own hands. Explore the island's 10 unique locations long enough to solve the mystery of why you're there - and what lies on the other side of the ocean...
While the game is mostly free to play, you can upgrade to "1st Class" to save your chan…
See how long you can survive on an island full of wildlife - and even wilder people! Compete for resouces with a new 2-handed control system that doubles the ways you can interact with the world around you - putting the power to create or destroy in your own hands. Explore the island's 10 unique locations long enough to solve the mystery of why you're there - and what lies on the other side of the ocean...
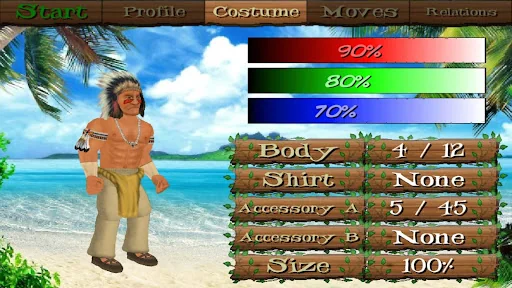
While the game is mostly free to play, you can upgrade to "1st Class" to save your changes to your character and every other. This also removes ads and increases your chances of surviving death to ensure you live your life to the fullest!
HOW TO PLAY
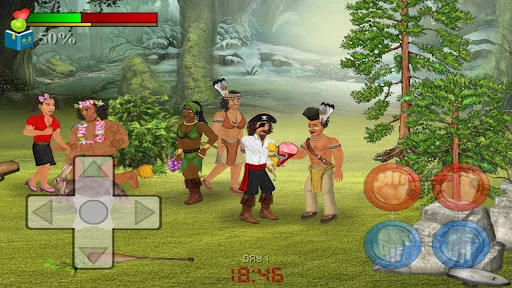
Players of previous games may need to take the time to adjust to the new control system, which distinguishes between the left or right hands:
* The RED fist buttons allow you to ATTACK from either side.
* The BLUE hand buttons allow you to PICK-UP or DROP with either hand (hold a direction to THROW).
+ Pressing BOTH buttons on either SIDE will attempt to USE what is in that hand - such as eating food or reading books (notice that some actions may cause you to swap hands to use them properly).
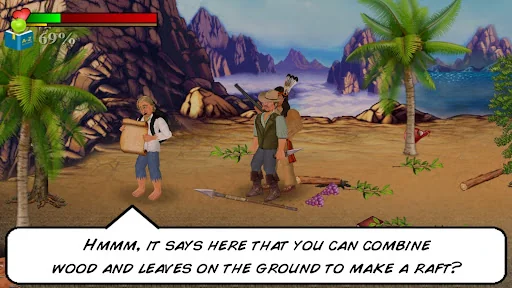
+ Pressing BOTH pick-up buttons together will COMBINE the objects you have in each hand or nearby on the ground. Both hands can also be used to pick up larger furniture - such as rafts - so long as they are empty and there is nothing closer to handle.
+ Pressing BOTH attack buttons together will attempt to GRAB your opponent (press again to release or any other combination of buttons to execute moves).
+ DOUBLE-TAP any direction to RUN.
- Touch the HEALTH METER to SLEEP when your energy is low.
- Touch the CLOCK to PAUSE - where you can exit or access other options.
I regret that there's more to this game than could ever be explained here, so please look out for additional hints in the game itself - or join the discussion on social media:
www.facebook.com/MDickieFans
www.twitter.com/MDickieDotcom
www.youtube.com/MDickieDotcom
Comparable Android apps
The five apps in Adventure with the closest revenue to Wrecked. Click any to see its detail page.
Each forecast combines App Store rating, ratings count, monetisation model, pricing tier, IAP signals and ad-supported flag.
The base estimate is then multiplied by a per-category scaling factor learned from apps with founder-verified MRR.
Every number on this page comes from public APIs and bumetric's own snapshot history.
Full methodology covers input variables, accuracy bands per category and how we treat apps without comparable anchors.
See also the live data on Wrecked's tracker page for current rating, reviews and snapshot timeline.
Building something similar? Get a free AI audit with $-revenue forecasts for every recommendation.

 Dino Transform Robot Car Game
 Sin City Detective – Hidden Ob
 Derby Car Crash Stunts
 Forgotten Hill: Puppeteer
 Animals hair salon