ML revenue forecast.
Calibrated against 31082 apps in this category.
Confidence band
±15%
High — many comparable apps with verified data
At a glance
Earns 1.83× more than the category median (146/mo).
Ranks #5,401 of 31,082 in Shopping (top 17.4% by revenue).
Launched Sep 23, 2019.
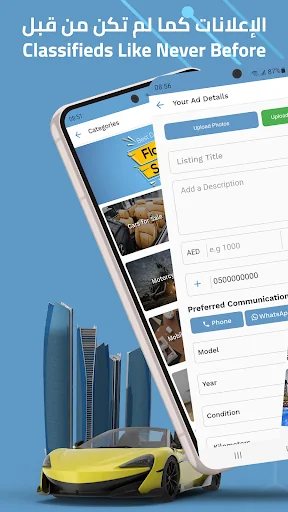
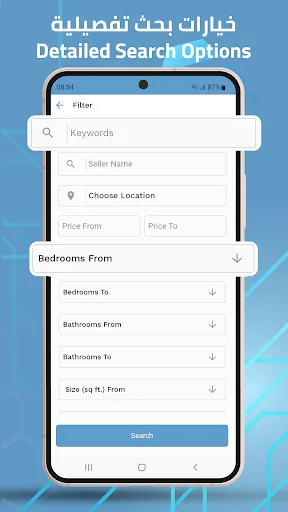
What the app looks like
Live screenshots from the Play Store, captured by our snapshot worker. Tap any image to enlarge.
Yalla Deals's revenue trajectory
Forecast revenue from snapshot history. Last 1 months.
Where Yalla Deals sits in Shopping
Revenue distribution of 31082 comparable apps. Yalla Deals highlighted.
Yalla Deals vs comparable apps
Revenue trajectory side-by-side. Bold = Yalla Deals, ghosted = peers.
App spec
Version
Varies with device
Launched
Sep 23, 2019
Price
Free
Monetization
Free
What Yalla Deals actually does (from store listing)
Yalla Deals is not just another classifieds portal; we go many steps further with our social media marketing engine "E-Socializer".
Yalla Deals with the help of E-Socializer "targets" the right people looking for something similar to what you are advertising by automatically placing your ad on a highly targeted marketing campaigns on different social media platforms. These campaigns were automatically created by a well-built artificial intelligence and machine learning algorithms to increase …
Yalla Deals is not just another classifieds portal; we go many steps further with our social media marketing engine "E-Socializer".
Yalla Deals with the help of E-Socializer "targets" the right people looking for something similar to what you are advertising by automatically placing your ad on a highly targeted marketing campaigns on different social media platforms. These campaigns were automatically created by a well-built artificial intelligence and machine learning algorithms to increase the chance for your ad to reach genuinely interested audience wherever they are and even if they don't have Yalla Deals installed on their smartphones.
On top of that, you can add a variety of chargeable on-site upgrades to let your ad stand out and attract more customers. Upgrades include:
• Featured & Urgent Badges.
• Highlighted ads.
On Yalla Deals you can post or search for anything in real estate, cars for sale, car for rent, electronics, furniture, jobs, and more! We also offer many built-in advanced features like 360 virtual tours for real estate properties, embedded videos, five easy ways to communication (Yalla Chat, Call, WhatsApp, SMS, Email), agents management, and easy to use ad performance metrics & scheduled reports.
Comparable Android apps
The five apps in Shopping with the closest revenue to Yalla Deals. Click any to see its detail page.
Each forecast combines App Store rating, ratings count, monetisation model, pricing tier, IAP signals and ad-supported flag.
The base estimate is then multiplied by a per-category scaling factor learned from apps with founder-verified MRR.
Every number on this page comes from public APIs and bumetric's own snapshot history.
Full methodology covers input variables, accuracy bands per category and how we treat apps without comparable anchors.
See also the live data on Yalla Deals's tracker page for current rating, reviews and snapshot timeline.
Building something similar? Get a free AI audit with $-revenue forecasts for every recommendation.


 So Ouest
 Body Cupid.
 Super Dalben
 구하다 – 명품을 제대로 직.구하다
 El Florido