ML revenue forecast.
Calibrated against 26282 apps in this category.
Confidence band
±15%
High — many comparable apps with verified data
At a glance
Earns 1.81× more than the category median (173/mo).
Ranks #7,001 of 26,282 in Casual (top 26.6% by revenue).
Launched Dec 07, 2018 · last updated Nov 20, 2025.
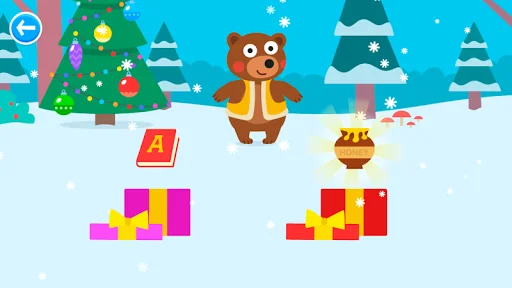
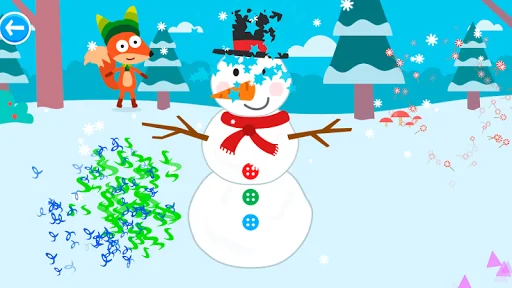
What the app looks like
Live screenshots from the Play Store, captured by our snapshot worker. Tap any image to enlarge.
Year Games's revenue trajectory
Forecast revenue from snapshot history. Last 1 months.
Where Year Games sits in Casual
Revenue distribution of 26282 comparable apps. Year Games highlighted.
Year Games vs comparable apps
Revenue trajectory side-by-side. Bold = Year Games, ghosted = peers.
App spec
Version
1.1.1
Last update
Nov 20, 2025
Launched
Dec 07, 2018
Price
Free
Monetization
Free
What Year Games actually does (from store listing)
So winter came, pure white snow fell. Christmas are coming very soon. During all these wonderful holidays and all winter vacations, surprisingly funny winter fun awaits us. To all the kids who love winter games, skiing, decorate a Christmas tree, sculpt a snowman and play snowballs, we dedicate a new game from the series of educational games for kids: “New Year Games”. Well, let's start! Dress warmer and go out!
Our whole game consists of a set of mini-games for winter themes. Here your…
So winter came, pure white snow fell. Christmas are coming very soon. During all these wonderful holidays and all winter vacations, surprisingly funny winter fun awaits us. To all the kids who love winter games, skiing, decorate a Christmas tree, sculpt a snowman and play snowballs, we dedicate a new game from the series of educational games for kids: “New Year Games”. Well, let's start! Dress warmer and go out!
Our whole game consists of a set of mini-games for winter themes. Here your kids will have to solve puzzles in order to collect all the Christmas-tree toys and find presents, roll balls of snow out of which you can make a funny snowman, going around obstacles and overtaking your rivals to ski down from the mountain. Also, you have a real winter battle - a game of snowballs with your friends, repair Christmas garland, you will need to run the New Year's fireworks and much more.
You can download and install our winter games for children on your android device absolutely free of charge and believe, you will not find the best game for the new year!
Visit us at: Site: https://yovogroup.com/
Comparable Android apps
The five apps in Casual with the closest revenue to Year Games. Click any to see its detail page.
Each forecast combines App Store rating, ratings count, monetisation model, pricing tier, IAP signals and ad-supported flag.
The base estimate is then multiplied by a per-category scaling factor learned from apps with founder-verified MRR.
Every number on this page comes from public APIs and bumetric's own snapshot history.
Full methodology covers input variables, accuracy bands per category and how we treat apps without comparable anchors.
See also the live data on Year Games's tracker page for current rating, reviews and snapshot timeline.
Building something similar? Get a free AI audit with $-revenue forecasts for every recommendation.


 Bubble Shooter 3
 Lovers of Aether
 Flamethrower Flashlight
 Jelly Witch: Match 3 Pop Candy
 Duck Evolution: Merge Game