Welcome to Yoshinoya Rewards!
You're one button away from a delicious Signature Gyūdon Beef Bowl®, mouth-watering Teriyaki Chicken Bowl or any one of our over 20+ delicious bowl options. Tap "Get" (for Apple App Store description) to receive exclusive coupons, offers and more!
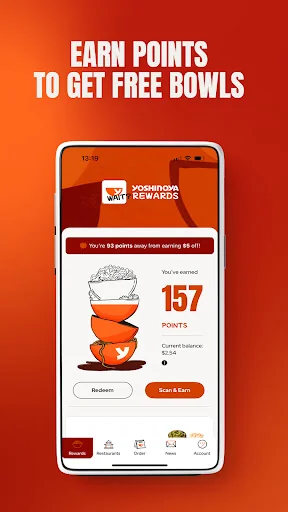
Rewards Program
- Earn rewards for every dollar you spend and redeem your points for everything from drinks and appetizers to bowls and desserts.
Skip the line and order ahead!
- Why wait for d…
You're one button away from a delicious Signature Gyūdon Beef Bowl®, mouth-watering Teriyaki Chicken Bowl or any one of our over 20+ delicious bowl options. Tap "Get" (for Apple App Store description) to receive exclusive coupons, offers and more!
Rewards Program
- Earn rewards for every dollar you spend and redeem your points for everything from drinks and appetizers to bowls and desserts.
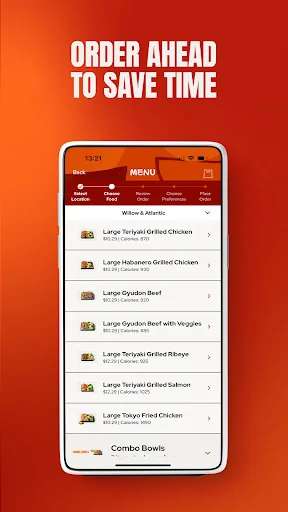
Skip the line and order ahead!
- Why wait for delicious food? Order on the app and pick-up at your favorite location.
Delivery
- Order whatever you want, wherever you want it. Order Delivery through the app and we'll bring the food to you.
Exclusive Deals & Offers
- Enjoy app-exclusive offers and deals that are good for your stomach (and your wallet).
Save Your Favorite Orders
- Save your favorite orders, so you can reorder with just one-click.
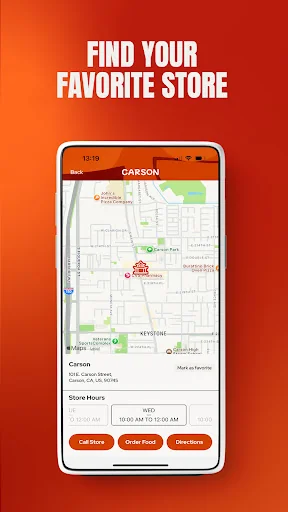
Store Locator
- Hungry for a bowl? Find your nearest Yoshinoya location.
Comparable Android apps
The five apps in Food & Drink with the closest revenue to Yoshinoya. Click any to see its detail page.
Each forecast combines App Store rating, ratings count, monetisation model, pricing tier, IAP signals and ad-supported flag.
The base estimate is then multiplied by a per-category scaling factor learned from apps with founder-verified MRR.
Every number on this page comes from public APIs and bumetric's own snapshot history.
Full methodology covers input variables, accuracy bands per category and how we treat apps without comparable anchors.
See also the live data on Yoshinoya's tracker page for current rating, reviews and snapshot timeline.
Building something similar? Get a free AI audit with $-revenue forecasts for every recommendation.


 Dan Murphy's
 Wajeez: Book Flights & more
 Texas Dairy Queen
 Family Express
 Рецепти