Meet YTN Radio on your mobile.
[Main service]
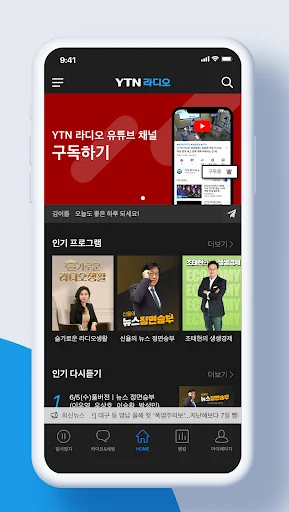
■ Live: Live 24 hours a day, you can watch radio.
■ Live Chat: You can participate in live chat while watching and listening live.
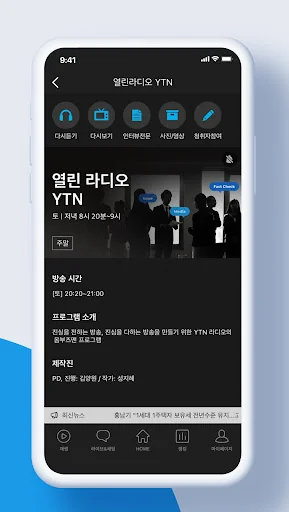
■ Listen to the broadcast again: You can listen to the main broadcast program again at any time.
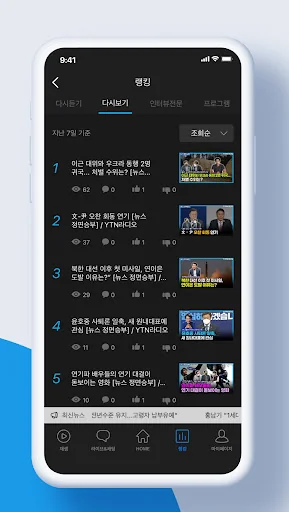
■ Ranking & Latest News: You can view the latest news and ranking content.
■ Real-time voting: You can vote directly on various issues.
■ Notification & Bookmark: You can set a notification (push) 5 minutes before the…
[Main service]
■ Live: Live 24 hours a day, you can watch radio.
■ Live Chat: You can participate in live chat while watching and listening live.
■ Listen to the broadcast again: You can listen to the main broadcast program again at any time.
■ Ranking & Latest News: You can view the latest news and ranking content.
■ Real-time voting: You can vote directly on various issues.
■ Notification & Bookmark: You can set a notification (push) 5 minutes before the broadcast, and you can collect only bookmarked contents.
[Service access authority guide]
In order to use the YTN radio app smoothly, we request the following access rights.
□ Required access rights
-Telephone: This is an essential permission to provide stable service.
□ Optional access rights
-Storage: When writing a post, access is required to attach photos and videos stored on the device to the app.
-Notification: This permission is required to provide the program listening notification function.
Selective access rights require permission when using the function, and services other than the function can be used even if not allowed.
※ If you are using a version lower than Android 6.0, you cannot individually allow the selection authority. Therefore, it is recommended to check if the manufacturer of your device provides an operating system upgrade and upgrade to Android 6.0 or higher if possible. Also, even if the operating system is upgraded, the access rights agreed to by the existing apps do not change, so in order to reset the access rights, you need to delete and reinstall the app you have already installed.
□ Support inquiry: overflow6@ytnplus.co.kr
Comparable Android apps
The five apps in News & Magazines with the closest revenue to YTN 라디오. Click any to see its detail page.
Each forecast combines App Store rating, ratings count, monetisation model, pricing tier, IAP signals and ad-supported flag.
The base estimate is then multiplied by a per-category scaling factor learned from apps with founder-verified MRR.
Every number on this page comes from public APIs and bumetric's own snapshot history.
Full methodology covers input variables, accuracy bands per category and how we treat apps without comparable anchors.
See also the live data on YTN 라디오's tracker page for current rating, reviews and snapshot timeline.
Building something similar? Get a free AI audit with $-revenue forecasts for every recommendation.


 Misteriosa Realidad: Misterios
 EL PERIÓDICO EXTREMADURA
 ตรวจหวย ตรวจลอตเตอรี่ QRCode
 NTPC Samvaad
 ETC-tidningarna