1.2M Android Apps Tracked Updated 4 min ago Revenue Forecasts
Add an app Create Account Sign In
Home

Show of Hands Polls & Politics

51
Quality Score
Solid

Show of Hands Polls & Politics

Medium confidence
3.6 ✍️ Editor
✍️ bumetric analysis

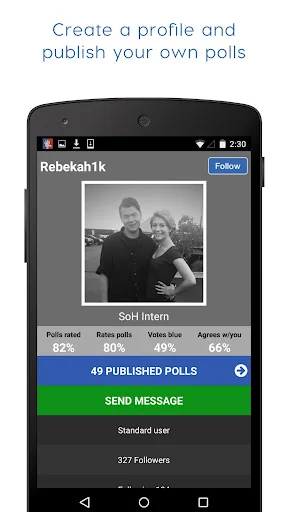
Show of Hands Polls & Politics is an Android app from Show of Hands, LLC in the Lifestyle category, currently rated 3.6★ across 955 ratings. Initial signal reads as mixed reviews: supporters praise core features while critics cite stability and value gaps.

Quality Score is 51: Solid (established niche player). For a Lifestyle app, that means established niche player. The full BU Investment Matrix below scores 8 dimensions including monetisation, growth, and operational risk.

Track changes month-over-month in the Performance section below: live snapshot history and revenue forecast included.

💰 Monthly revenue · now vs forecast
● Right now
$500
per month
12-mo forecast
$437 – $1575
per month
24-mo forecast
$405 – $3644
per month
INDIE tier
💡 Grow this revenue
Free AI audit of this app’s store listing
  • Title & subtitle keyword fit
  • Description hook & conversion structure
  • Screenshots, ratings, reviews strategy
Run free AI audit →
Typical impact: +2-5× organic installs
🔔Notify me when this app's revenue changes by

📊 Performance Tracking LIVE

Loading…
idle
0%
Rating
Reviews
Forecast Revenue / mo
Snapshots tracked
0
since first record
ONE-TIME · BUILD 💰 Estimated build cost
$80K
What it cost to build · not monthly revenue
Likely range $60K – $110K
$25K · MVP floor $100K · indie scale $500K+ · studio build
📈 Slow ROI — current MRR is well below build cost

Synthetic estimate. Inputs: category complexity, file size, screen count, monetization layer, platform reach, age × team-size proxy. Calibrated against 2024-2026 indie-agency rate surveys. Full math + source list on /methodology.

Where the money goes
🧱 MVP baseline (design + 1-store ship) +$28K
📱 5 unique screens × $4.5K +$22K
Lifestyle complexity ×1.05 +$2K
🌐 Cross-platform reach (iOS + Android) +$29K
Total estimate $80K
👥 Estimated audience size
105K
Lifetime downloads (US-equivalent)
Monthly active
13K
Daily active
2.7K

Synthetic estimate from ratings × category benchmarks. Calibrated against 2024-2026 mobile-attribution retention + DAU/MAU reports. Numbers are US-storefront-equivalent — true global audience can be 5-10× larger for international apps. Full math + source list on /methodology.

How we sized it
📲 Lifestyle engagement ~110 installs / rating
🔁 Lifestyle D30 retention 13%
📍 DAU / MAU stickiness 0.20
DAU / MAU 20% sticky
🔬

How we forecast this revenue

LOW CONFIDENCE
Baseline
$500/mo · ML-estimated from 234 triggers
Growth rate
+6.0% MoM · INDIE tier baseline (compound monthly)
6 months
$426 – $993
12 months
$437 – $1.6K
24 months
$405 – $3.6K
Compound growth at +6.0% MoM (tier baseline for INDIE). Range widens with horizon — typical noise band ±40% at 6mo.. Ranges widen with horizon — distant futures carry more uncertainty.
📊

BU Investment Matrix

Pre-traction · 36/100INDIE TIERlimited signal
RevenueQualityMarketGrowthMoatSafetyFounderMonetiz.
Revenue Strength
2.7
Product Quality
5.0
Market Position
0.0
Growth Velocity
5.0
Defensibility
4.5
Operational Safety
7.0
Founder Strength
3.7
Monetization Maturity
1.0
  • 💰 Revenue: Marginal — $200 - $1250/mo · INDIE tier · medium confidence, trajectory unclear.
  • ⭐ Quality: 3.57★ across 955 reviews — below category median.
  • 📍 Market: Not yet charting in any of the 9 monitored markets.
  • 📈 Growth: ⚠ last update 1273d ago — possibly dormant.
  • ⚠️ Risk: Moderate — dormant (1273d since update).
🎯 For competitors: Mixed picture. Worth competing if you have a clear UX or pricing edge — otherwise crowded segment.
💵 For acquirers: Estimated asking range 18-32× monthly = $9K-$16K.
Composite of 8 dimensions computed deterministically from public signals — no LLM, every score traces back to a measurable input. Default weights shown; "compete" / "acquire" / "invest" lenses re-weight without re-fetching.
Range:

💰 Forecast Revenue / mo

MODEL
Revenue forecast computed from BU's 234 trigger model on each snapshot. Calibrated against ground-truth from 58 verified-revenue apps.
🔬Forecast Breakdown — Why This Estimate?Top 3 of 3 triggers
Our ML model uses 200+ signals from public data. These are the most influential for this app:
Mature app (14y old)METRIC
+$1,500
Ad-supported / freemiumMETRIC
+$600
Early-stage install base (955 ratings)METRIC
+$400
METRIC = structural app data · REVIEW = mined from user reviews · ✓ VERIFIED = Stripe-verified anchor (TrustMRR)

📈 Reviews Growth

LIVE
Cumulative review count from first BU snapshot. Each point = a tracked update.

⭐ Rating Trend

LIVE
Average rating evolution. Updates with each new review batch.

Profile & Insights

Everything we know — and don't — about this app and its company.

Identification

App name
Show of Hands Polls & Politics
Developer
Show of Hands, LLC
Bundle ID
com.soh.soh
App Store URL
Open in App Store
Category
Lifestyle
Content rating
Not found
Languages
Not found

Company

Website
www.showofhands.com
Tagline
Not found
Description
Not found
Founded
Not found
HQ / Address
Not found
Employees
Not found
Logo
Not found

Revenue

Verified revenue / mo
Not found
AI revenue estimate / mo
Not found
AI annual estimate
Not found
ML model estimate / mo
$474/mo
Top-grossing rank
Not found
All-time revenue
Not found
Pricing
Not found

Founder

Founder data not yet collected for this app.

Funding

Funding data not yet collected for this app.

Press & Links

Press & Links data not yet collected for this app.

Contacts & Socials

Contacts & Socials data not yet collected for this app.
📈Ratings growth955 ratings+6% lifetimeShow 3-year history estimate ▾
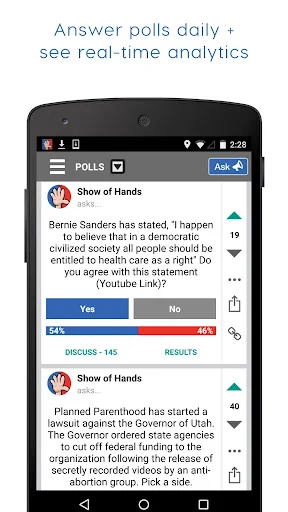
Jun 2023Jan 2025Jun 2026
Tracked (1 weeks) Pre-tracking estimate (37 weeks) · model-based, ±5% noise · anchored to release date and current value
Profile is built from iTunes Lookup + developer site scrape + ML revenue model. Empty fields show "Not found" — additional sources (Crunchbase, X, IndieHackers, Acquire.com) coming.

📝 About this app

Show of Hands is a smart and fun community polling platform for people who love burning questions! Answer new questions daily and see instant, real-time, anonymous results from fellow brilliant minds around the country. This information is broken down by age, religion, income, and more! (You can just think of us as your national level town hall.)

We have a work hard, play harder mentality in our question-asking: we ask the tough questions so that you can anonymously debate real world issues, and we ask the lighter questions because sometimes Mondays are just hard.… View full description on the official store →
App Specs
🔐 Own this app? Claim & verify MRR →
🔖 v6.2.7🔄 updated 0d ago📂 Lifestyle💰 Free📺 Ad-supported
🧪

Tech & Domain Intel — showofhands.com

Mail provider
Zoho Mail
Tech stack
Zoho
Derived from public RDAP + DNS TXT records (no scraping, no login).
🔔

Track this app’s revenue

FREE
Get an email when revenue moves by your threshold. No spam, unsubscribe in one click.

📝 Description

95
BU Score · Transcendent
Full revenue analysis
Read the article-style breakdown for Show of Hands Polls & Politics: category rank, percentile, growth signal, comparable apps, and how the forecast is calibrated against verified-MRR anchors in this niche.
Read deep-dive →

Similar apps in Lifestyle

About this analysis
ZCAnalyzed by Zakhar Chumak · founder, bumetric·Full methodology·Medium confidence

Why medium confidence: 955 ratings · no founder-verified revenue (model estimate only).

Frequently Asked Questions

4 answers · auto-generated from this app's public data
How much does Show of Hands Polls & Politics make per month?
Based on our ML-calibrated revenue forecast, Show of Hands Polls & Politics earns approximately $474/mo. This is a US-storefront-equivalent estimate; global revenue can be several times larger for internationally-distributed apps. See the methodology page for the full formula and confidence bands.
What apps are like Show of Hands Polls & Politics?
Browse the full Lifestyle category catalog to find similar apps with revenue, build cost, audience and tech stack data. Each /p/{slug} page also shows a Compare side-by-side widget with three peer apps from the same niche.
Who makes Show of Hands Polls & Politics?
Show of Hands Polls & Politics is published by Show of Hands, LLC on the Google Play Store. See the full publisher portfolio (other apps by the same developer) via the More by developer block on the product page above.
What is Show of Hands Polls & Politics's BU Score?
Show of Hands Polls & Politics has a BU Score of 51/100 (Solid). The score combines App Store rating, ratings count, monetization model and revenue signals calibrated against founder-verified MRR anchors. See the BU Score formula.