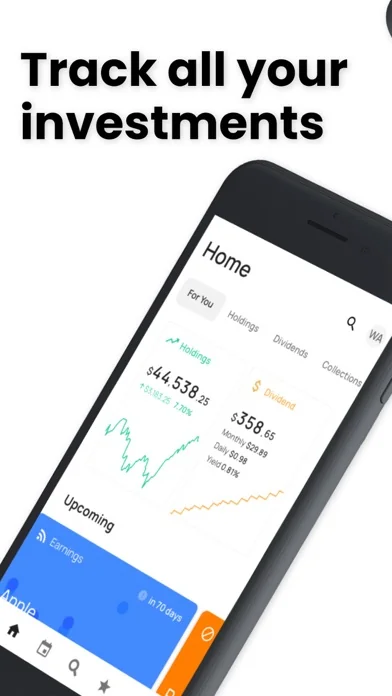
Stock Events Portfolio Tracker


 75
75


Stock Events Portfolio Tracker
Stock Events Portfolio Tracker is an iOS app from Stock Events GmbH in the Finance category, currently rated 4.8★ across 2,084 ratings. Initial signal reads as largely positive sentiment, users highlighting consistency and feature depth.
Quality Score is 75: Strong (healthy traction). For a Finance app, that means healthy traction. The full BU Investment Matrix below scores 8 dimensions including monetisation, growth, and operational risk.
Track changes month-over-month in the Performance section below: live snapshot history and revenue forecast included.
- Title & subtitle keyword fit
- Description hook & conversion structure
- Screenshots, ratings, reviews strategy
📊 Performance Tracking LIVE

Synthetic estimate. Inputs: category complexity, file size, screen count, monetization layer, platform reach, age × team-size proxy. Calibrated against 2024-2026 indie-agency rate surveys. Full math + source list on /methodology.
| 🧱 MVP baseline (design + 1-store ship) | +$28K |
| 📱 5 unique screens × $4.5K | +$22K |
| 📦 Asset bundle (54 MB) | +$1K |
| ⚙ Finance complexity ×1.60 | +$31K |
Synthetic estimate. Multiple band derived from ad-supported + age, rating quality, category demand, and user-base maturity. Calibrated against 2024-2026 indie-app-marketplace closed-deal medians. Full math + comparable deal list on /methodology.
| 📺 Ad-supported base | 15× MRR |
| ⭐ ★ rating ≥ 4.7 (premium) | +15% |
| 🏷 Finance category multiple | +15% |
Synthetic estimate from ratings × category benchmarks. Calibrated against 2024-2026 mobile-attribution retention + DAU/MAU reports. Numbers are US-storefront-equivalent — true global audience can be 5-10× larger for international apps. Full math + source list on /methodology.
| 📲 Finance engagement | ~60 installs / rating |
| 🔁 Finance D30 retention | 28% |
| 📍 DAU / MAU stickiness | 0.40 |
How we forecast this revenue
MEDIUM CONFIDENCEBU Investment Matrix
Building · 60/100MID TIERSUBSCRIPTIONcompetitive build-out- 💰 Revenue: Modest — $3K - $8K/mo · MID tier · medium confidence, trajectory unclear.
- ⭐ Quality: 4.81★ across 2,084 reviews — strong (top 10%).
- 📍 Market: Not yet charting in any of the 9 monitored markets.
- 📈 Growth: Insufficient signal to assess trajectory.
- ⚠️ Risk: Low — no material risk signals detected.
💰 Forecast Revenue / mo
MODEL| Paid app ($0.00)METRIC | +$2,800 | |
| Excellent rating (4.8★)METRIC | +$2,200 | |
| 5 starREVIEW | +$1,800 | |
| cancelledREVIEW | −$1,500 | |
| excellent appREVIEW | +$1,500 | |
| Low install base (2,084 ratings)METRIC | +$1,500 | |
| Multilingual (19 languages)METRIC | +$1,500 | |
| highly recommendREVIEW | +$1,400 | |
| too expensiveREVIEW | −$1,000 | |
| Established app (6y old)METRIC | +$800 |
📈 Reviews Growth
LIVE⭐ Rating Trend
LIVE🆕 What's New · v9.35.4
- New: Wallet and Crypto Exchange Connections
- Many improvements and bugfixes
Love Stock Events? Leave feedback and a rating to let us know! And make sure to give us a shout at support@stockevents.… Full release notes →
Profile & Insights
Identification
- App name
- Stock Events Portfolio Tracker
- Developer
- Stock Events GmbH
- Bundle ID
- app.stockevents.ios
- App Store URL
- Open in App Store
- Category
- Finance
- Content rating
- 17+
- Languages
- AR, NL, EN, FR, DE, HE, ID, IT, JA, KO, MS, PL, PT, ZH, ES, SV, TH, ZH, TR
Company
- Website
- Not found
- Tagline
- Just one look is enough
- Description
- Instantly Know What’s Happening with Your Investments - For those who want to know more without the noise.
- Founded
- Not found
- HQ / Address
- Not found
- Employees
- Not found
- Logo
- Available
Revenue
- Verified revenue / mo
- Not found
- AI revenue estimate / mo
- Not found
- AI annual estimate
- Not found
- ML model estimate / mo
- $13.1K/mo
- Top-grossing rank
- 🇦🇺#41 /100 🇨🇦#42 /100 🇬🇧#58 /100
- All-time revenue
- Not found
- Pricing
- Not found
Founder
Funding
Press & Links
Contacts & Socials
- Socials
- twitter twitter.com/StockEventsApp
- Not found
- Phone
- Not found
- Contact page
- stockevents.app/en/help
- About page
- Not found
📈Ratings growth2,084 ratings+64% lifetimeShow 3-year history estimate ▾
📝 About this app
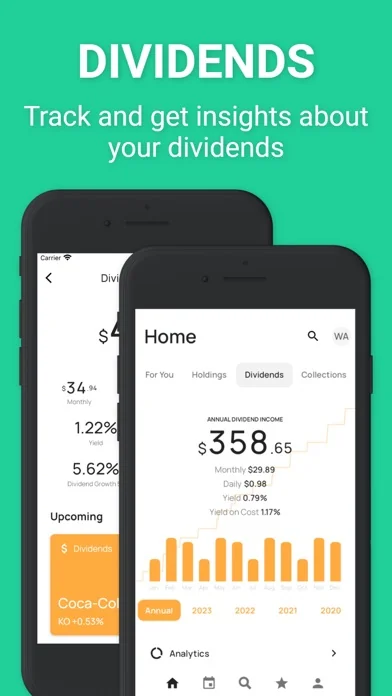
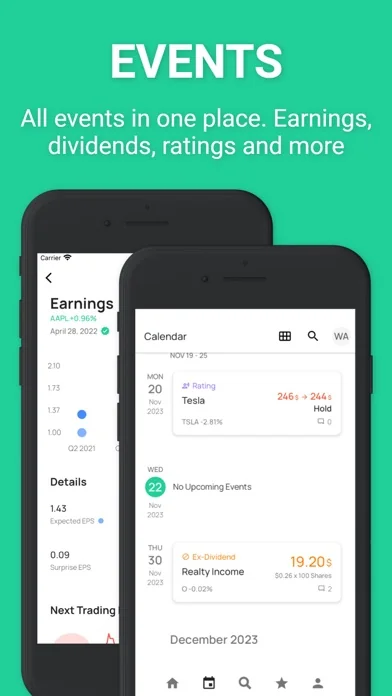
Stock Events is a portfolio tracker, dividend tracker, and earnings calendar that helps you track your portfolio, upcoming dividends, ex-dividend dates, passive income, and key market events in one app.
Whether you invest for dividend growth, passive income, or long-term wealth building, Stock Events helps you follow portfolio performance, dividend income, earnings reports, price alerts, and major stock market events.
Portfolio Tracker… View full description on the official store →
What Worked™ · Development Pipeline
12 EVENTS TRACKEDASO Keyword Positions
BEST RANK #48Voice of Customer
Based on 362 reviews across 9 marketsMulti-Country Performance
Available in 9 of 9 monitored markets| Market | Rating | Reviews | Current version |
|---|---|---|---|
| 🇦🇺 AU | 4.57843★ | 102 | 4.57843★ this version |
| 🇧🇷 BR | 4.875★ | 40 | 4.875★ this version |
| 🇨🇦 CA | 4.80829★ | 1,617 | 4.80829★ this version |
| 🇩🇪 DE | 4.68367★ | 294 | 4.68367★ this version |
| 🇫🇷 FR | 4.78652★ | 178 | 4.78652★ this version |
| 🇬🇧 GB | 4.76689★ | 725 | 4.76689★ this version |
| 🇮🇳 IN | 4.7037★ | 27 | 4.7037★ this version |
| 🇯🇵 JP | 4.52414★ | 145 | 4.52414★ this version |
| 🇺🇸 US | 4.80476★ | 2,100 | 4.80476★ this version |
Track this app’s revenue
FREE📝 Description
95


Why medium confidence: 2,084 ratings · no founder-verified revenue (model estimate only).