29K iOS Apps Tracked Updated 2 min ago Revenue Forecasts
Add an app Create Account Sign In
Home

Planning Center Services

61
Quality Score
Solid

Planning Center Services

Medium confidence
4.1 ✍️ Editor
✍️ bumetric analysis

Planning Center Services is an iOS app from Planning Center in the Business category, currently rated 4.1★ across 8,811 ratings. Initial signal reads as mixed reviews: supporters praise core features while critics cite stability and value gaps.

Quality Score is 61: Solid (established niche player). For a Business app, that means established niche player. The full BU Investment Matrix below scores 8 dimensions including monetisation, growth, and operational risk.

Track changes month-over-month in the Performance section below: live snapshot history and revenue forecast included.

💰 Monthly revenue · now vs forecast
● Right now
$1.4M
per month
12-mo forecast
$1.5M – $2.3M
per month
24-mo forecast
$1.8M – $3.3M
per month
BIG tier
💡 Grow this revenue
Free AI audit of this app’s store listing
  • Title & subtitle keyword fit
  • Description hook & conversion structure
  • Screenshots, ratings, reviews strategy
Run free AI audit →
Typical impact: +2-5× organic installs
🔔Notify me when this app's revenue changes by

📊 Performance Tracking LIVE

Loading…
idle
0%
Rating
Reviews
Forecast Revenue / mo
Snapshots tracked
0
since first record
ONE-TIME · BUILD 💰 Estimated build cost
$105K
What it cost to build · not monthly revenue
Likely range $80K – $140K
$25K · MVP floor $100K · indie scale $500K+ · studio build
📈 Slow ROI — current MRR is well below build cost

Synthetic estimate. Inputs: category complexity, file size, screen count, monetization layer, platform reach, age × team-size proxy. Calibrated against 2024-2026 indie-agency rate surveys. Full math + source list on /methodology.

Where the money goes
🧱 MVP baseline (design + 1-store ship) +$28K
📱 5 unique screens × $4.5K +$22K
📦 Asset bundle (99 MB) +$19K
Business complexity ×1.50 +$35K
Total estimate $105K
ONE-TIME · EXIT VALUE 💵 Estimated acquisition value
$15K
What it would sell for · not monthly revenue
Marketplace range $10K – $20K · 16× MRR multiple
💸 ~0.1× build cost (under-water)

Synthetic estimate. Multiple band derived from ad-supported + age, rating quality, category demand, and user-base maturity. Calibrated against 2024-2026 indie-app-marketplace closed-deal medians. Full math + comparable deal list on /methodology.

How the multiple was built
📺 Ad-supported base 15× MRR
🏷 Business category multiple +10%
Final multiple 16× MRR
👥 Estimated audience size
570K
Lifetime downloads (US-equivalent)
Monthly active
125K
Daily active
37K

Synthetic estimate from ratings × category benchmarks. Calibrated against 2024-2026 mobile-attribution retention + DAU/MAU reports. Numbers are US-storefront-equivalent — true global audience can be 5-10× larger for international apps. Full math + source list on /methodology.

How we sized it
📲 Business engagement ~65 installs / rating
🔁 Business D30 retention 22%
📍 DAU / MAU stickiness 0.30
DAU / MAU 30% sticky
🔬

How we forecast this revenue

MEDIUM CONFIDENCE
Baseline
$1.4M/mo · ML-estimated from 234 triggers
Growth rate
+2.5% MoM · BIG tier baseline (compound monthly)
6 months
$1.4M – $1.9M
12 months
$1.5M – $2.3M
24 months
$1.8M – $3.3M
Compound growth at +2.5% MoM (tier baseline for BIG). Range widens with horizon — typical noise band ±15% at 6mo.. Ranges widen with horizon — distant futures carry more uncertainty.
📊

BU Investment Matrix

Mixed signals · 56/100BIG TIERcompetitive but cautious
GrowthFounderQualityRevenueMonetiz.MoatMarketSafety
Growth Velocity
5.0
Founder Strength
6.0
Product Quality
7.4
Revenue Strength
6.1
Monetization Maturity
1.0
Defensibility
7.5
Market Position
2.0
Operational Safety
10.0
  • 💰 Revenue: Healthy — $560K - $3080K/mo · BIG tier · medium-low confidence, trajectory unclear.
  • ⭐ Quality: 4.11★ across 8,811 reviews — solid.
  • 📍 Market: Not yet charting in any of the 9 monitored markets.
  • 📈 Growth: Insufficient signal to assess trajectory.
  • ⚠️ Risk: Low — no material risk signals detected.
🎯 For competitors: Mixed picture. Worth competing if you have a clear UX or pricing edge — otherwise crowded segment.
💵 For acquirers: Estimated asking range 18-32× monthly = $25.2M-$44.8M.
Composite of 8 dimensions computed deterministically from public signals — no LLM, every score traces back to a measurable input. Default weights shown; "compete" / "acquire" / "invest" lenses re-weight without re-fetching.
Range:

💰 Forecast Revenue / mo

MODEL
Revenue forecast computed from BU's 234 trigger model on each snapshot. Calibrated against ground-truth from 58 verified-revenue apps.
🔬Forecast Breakdown — Why This Estimate?Top 11 of 11 triggers
Our ML model uses 200+ signals from public data. These are the most influential for this app:
bugsREVIEW
−$1,800
5 starREVIEW
+$1,800
Low install base (8,811 ratings)METRIC
+$1,500
Mature app (15y old)METRIC
+$1,500
highly recommendREVIEW
+$1,400
slowREVIEW
−$1,200
too expensiveREVIEW
−$1,000
support teamREVIEW
+$900
Good rating (4.1★)METRIC
+$800
Ad-supported / freemiumMETRIC
+$600
Single-language (English only)METRIC
−$400
METRIC = structural app data · REVIEW = mined from user reviews · ✓ VERIFIED = Stripe-verified anchor (TrustMRR)

📈 Reviews Growth

LIVE
Cumulative review count from first BU snapshot. Each point = a tracked update.

⭐ Rating Trend

LIVE
Average rating evolution. Updates with each new review batch.

Profile & Insights

Everything we know — and don't — about this app and its company.

Identification

App name
Planning Center Services
Developer
Planning Center
Bundle ID
com.ministrycentered.PlanningCenter
App Store URL
Open in App Store
Category
Business
Content rating
12+
Languages
EN

Company

Website
help.planningcenter.com
Tagline
Not found
Description
Not found
Founded
Not found
HQ / Address
Not found
Employees
Not found
Logo
Not found

Revenue

Verified revenue / mo
Not found
AI revenue estimate / mo
Not found
AI annual estimate
Not found
ML model estimate / mo
$861/mo
Top-grossing rank
Outside top 100 in US Business
All-time revenue
Not found
Pricing
Not found

Founder

Founder data not yet collected for this app.

Funding

Funding data not yet collected for this app.

Press & Links

Press & Links data not yet collected for this app.

Contacts & Socials

Contacts & Socials data not yet collected for this app.
📈Ratings growth8,811 ratings+29% lifetimeShow 3-year history estimate ▾Jul 2023Oct 2025Jul 2026
Tracked (51 weeks) Pre-tracking estimate (36 weeks) · model-based, ±5% noise · anchored to release date and current value
🌍Geographic ReachNot ranked
This app is currently outside the top 100 grossing in all 9 countries we monitor (US, UK, DE, FR, JP, CA, AU, BR, IN). Niche or new apps often launch this way — popularity rankings appear once daily revenue clears the regional threshold.
🚀Version Release Timeline2 releases tracked
v6.8.4May 2026v6.9.3Jun 2026
Profile is built from iTunes Lookup + developer site scrape + ML revenue model. Empty fields show "Not found" — additional sources (Crunchbase, X, IndieHackers, Acquire.com) coming.

📝 About this app

You must already have an account with Planning Center to use this app. To sign up for an account subscription, have your organization's administrator go to https://planningcenter.com

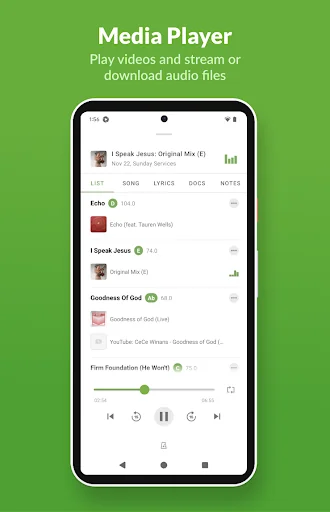
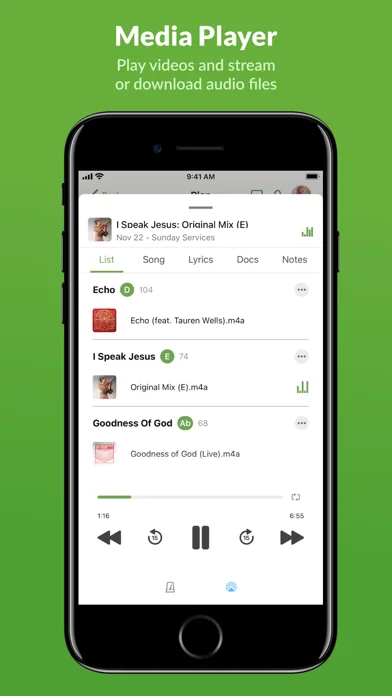
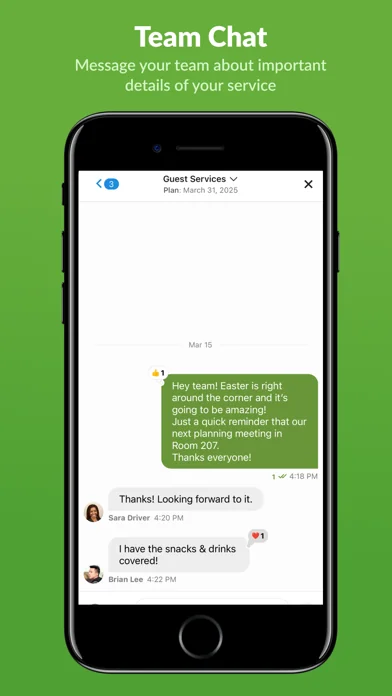
===== Planning Center Services: ======

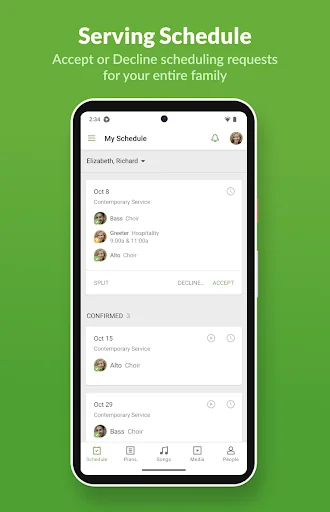
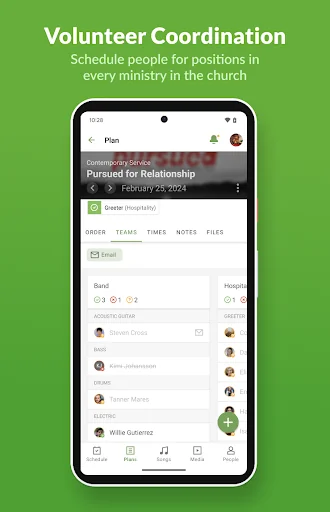
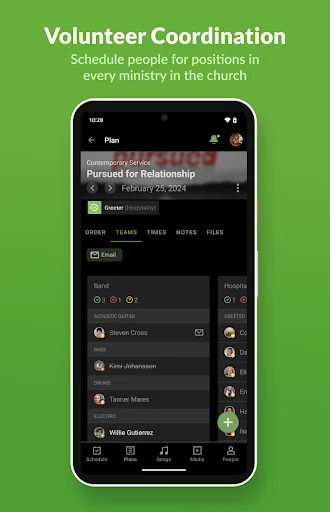
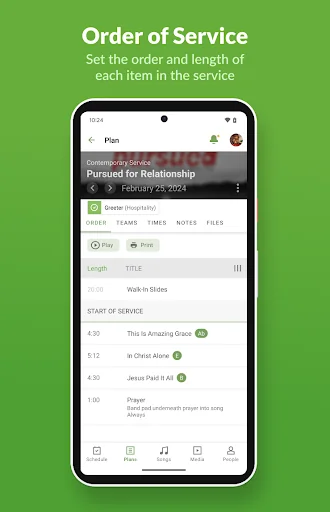
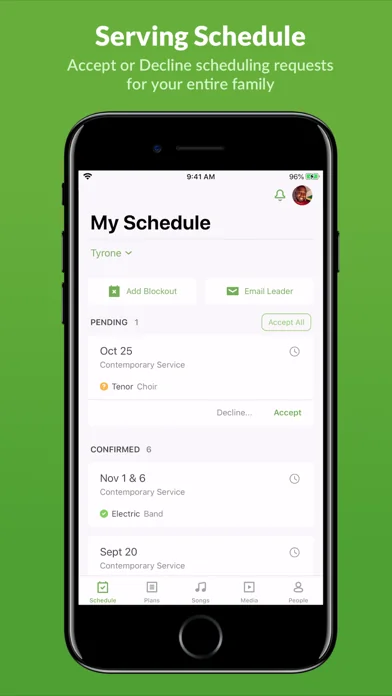
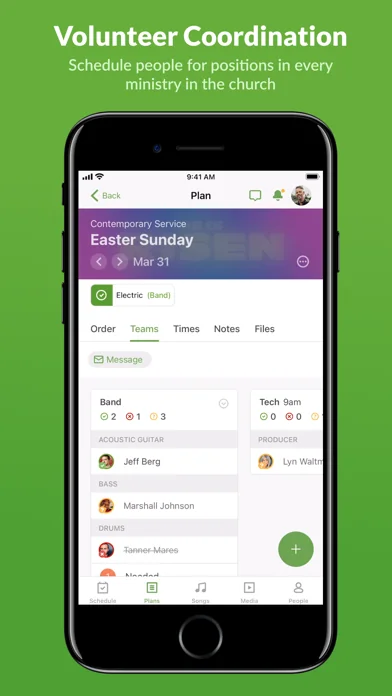
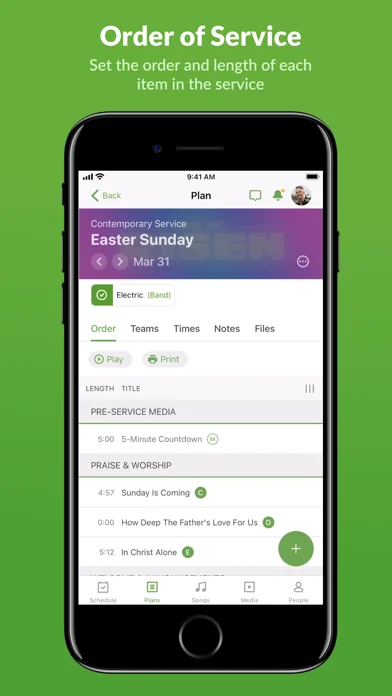
Planning Center Services is an online scheduling and worship planning application to keep your staff and volunteers connected.

With our native Android app, you get an optimized Planning Center Services experience wherever you are! You can manage your schedule, accept or decline requests, blockout dates, or upload your profile picture.… View full description on the official store →
App Specs
🔐 Own this app? Claim & verify MRR →
💾 99 MB🔞 12+📱 iOS 15.1+🔖 v6.9.3🔄 updated 0d ago🌐 EN📂 Business💰 Paid
📅

What Worked™ · Development Pipeline

20 EVENTS TRACKED
Detected changes in this app over its tracked lifetime — each event links cause (what changed) to effect (what moved). Sorted newest first.See full history →Version history →
2026-06
📸
Refreshed store screenshots — 5 of 8 updated
2026-06
📈
Crossed 5,000 ratings — social-proof flywheel kicking in
2026-06
Rating ↑ 3.74 → 4.11 (improved 0.37★)
2026-06
🔧
Shipped update — v6.8.4 → v6.9.3
→ 30 days after: revenue −$861/mo · rating +0.37★ · reviews +6,685 low · multiple changes
2026-05
Rating ↑ 2.72 → 3.74 (improved 1.02★)
→ 30 days after: revenue −$861/mo · rating +0.37★ · reviews +6,685 high confidence
2026-05
📈
Crossed 1,000 ratings — social-proof flywheel kicking in
→ 30 days after: revenue −$861/mo · rating +0.37★ · reviews +6,685 high confidence
2026-03
Rating ↓ 3.70 → 2.72 (dropped 0.98★)
→ 30 days after: revenue −$3.1K/mo · reviews +31 medium · co-occurring
2026-03
Rating ↑ 2.72 → 3.70 (improved 0.98★)
2026-03
📈
Crossed 500 ratings — social-proof flywheel kicking in
2020-02
📈
Crossed 100 ratings — social-proof flywheel kicking in
2020-02
📈
Crossed 100 ratings — social-proof flywheel kicking in
→ 30 days after: rating −0.05★ · reviews +16 high confidence
2019-09
📈
Crossed 50 ratings — social-proof flywheel kicking in
→ 30 days after: rating −0.08★ · reviews +14 high confidence
2019-09
📈
Crossed 50 ratings — social-proof flywheel kicking in
→ 30 days after: revenue +$54/mo · rating −0.31★ · reviews +32 high confidence
2019-04
Rating ↓ 3.70 → 3.07 (dropped 0.63★)
→ 30 days after: reviews +5 high confidence
2019-03
📈
Crossed 10 ratings — social-proof flywheel kicking in
→ 30 days after: rating −0.63★ · reviews +5 high confidence
2019-03
Rating ↓ 4.25 → 3.80 (dropped 0.45★)
→ 30 days after: rating −0.30★ · reviews +7 high confidence
2019-02
🚀
First tracked snapshot — initial data captured
→ 30 days after: rating −0.30★ · reviews +7 high confidence
2019-02
Rating ↓ 4.50 → 4.00 (dropped 0.50★)
→ 30 days after: rating −0.30★ · reviews +7 high confidence
2019-02
Rating ↑ 4.00 → 4.50 (improved 0.50★)
→ 30 days after: rating −0.30★ · reviews +7 medium · co-occurring
2019-02
🚀
First tracked snapshot — initial data captured
→ 30 days after: rating −0.30★ · reviews +7 medium · co-occurring
📸

Store Page History

5 SCREENSHOT CHANGES
Every time a developer swaps a store screenshot we archive both versions. Compare side-by-side to see what messaging / visuals changed.
iPhone screenshots
Slot 1
2 ver.
2026-05-12
Now
2026-06-12
Slot 2
2 ver.
2026-05-12
Now
2026-06-12
Slot 3
2 ver.
2026-05-12
Now
2026-06-12
Slot 4
2 ver.
2026-05-12
Now
2026-06-12
Slot 5
2 ver.
2026-05-12
Now
2026-06-12
🔎

ASO Keyword Positions

BEST RANK #42
Ranked for 1 App Store search query in our last keyword sweep. Lower position = closer to the top.
scheduling·#42🇺🇸
Last sweep: 2026-05-19 · iTunes Search API
🌍

Multi-Country Performance

Available in 9 of 9 monitored markets
MarketRatingReviewsCurrent version
🇦🇺 AU3.84746★593.84746★ this version
🇧🇷 BR3.49123★573.49123★ this version
🇨🇦 CA4.28049★824.28049★ this version
🇩🇪 DE4.23076★264.23076★ this version
🇫🇷 FR3.38462★133.38462★ this version
🇬🇧 GB4.29629★274.29629★ this version
🇮🇳 IN5★105★ this version
🇯🇵 JP5★35★ this version
🇺🇸 US3.74486★2,1403.74486★ this version
🔔

Track this app’s revenue

FREE
Get an email when revenue moves by your threshold. No spam, unsubscribe in one click.

📝 Description

95
BU Score · Transcendent
Full revenue analysis
Read the article-style breakdown for Planning Center Services: category rank, percentile, growth signal, comparable apps, and how the forecast is calibrated against verified-MRR anchors in this niche.
Read deep-dive →

More by Planning Center

View all →
📦 Portfolio summaryINDIE studio
8apps·$3K/mocombined
✓ Diversified — top app contributes 27%; risk spread across portfolio

Similar apps in Business

About this analysis
ZCAnalyzed by Zakhar Chumak · founder, bumetric·Full methodology·Medium confidence

Why medium confidence: 8,811 ratings · no founder-verified revenue (model estimate only).

Frequently Asked Questions

4 answers · auto-generated from this app's public data
How much does Planning Center Services make per month?
Based on our ML-calibrated revenue forecast, Planning Center Services earns approximately $861/mo. This is a US-storefront-equivalent estimate; global revenue can be several times larger for internationally-distributed apps. See the methodology page for the full formula and confidence bands.
What apps are like Planning Center Services?
Browse the full Business category catalog to find similar apps with revenue, build cost, audience and tech stack data. Each /p/{slug} page also shows a Compare side-by-side widget with three peer apps from the same niche.
Who makes Planning Center Services?
Planning Center Services is published by Planning Center on the Apple App Store. See the full publisher portfolio (other apps by the same developer) via the More by developer block on the product page above.
What is Planning Center Services's BU Score?
Planning Center Services has a BU Score of 61/100 (Solid). The score combines App Store rating, ratings count, monetization model and revenue signals calibrated against founder-verified MRR anchors. See the BU Score formula.