The Best of Logan
 57
57


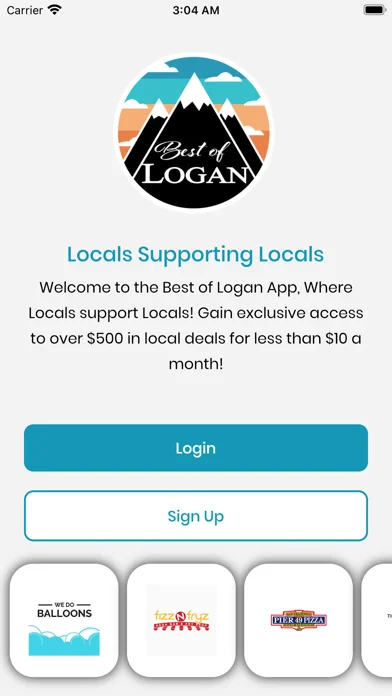
The Best of Logan
The Best of Logan is an iOS app from Rise social LLC in the Shopping category, currently rated 4.0★ across 30 ratings. Initial signal reads as mixed reviews: supporters praise core features while critics cite stability and value gaps.
Quality Score is 57: Solid (established niche player). For a Shopping app, that means established niche player. The full BU Investment Matrix below scores 8 dimensions including monetisation, growth, and operational risk.
Track changes month-over-month in the Performance section below: live snapshot history and revenue forecast included.
- Title & subtitle keyword fit
- Description hook & conversion structure
- Screenshots, ratings, reviews strategy
📊 Performance Tracking LIVE
Synthetic estimate. Inputs: category complexity, file size, screen count, monetization layer, platform reach, age × team-size proxy. Calibrated against 2024-2026 indie-agency rate surveys. Full math + source list on /methodology.
| 🧱 MVP baseline (design + 1-store ship) | +$28K |
| 📱 5 unique screens × $4.5K | +$22K |
| ⚙ Shopping complexity ×1.30 | +$15K |
Synthetic estimate. Multiple band derived from ad-supported + age, rating quality, category demand, and user-base maturity. Calibrated against 2024-2026 indie-app-marketplace closed-deal medians. Full math + comparable deal list on /methodology.
| 📺 Ad-supported base | 15× MRR |
| ⭐ ★ rating 3.5-4.0 (mixed) | -8% |
| 🏷 Shopping category multiple | +2% |
| ⭐ Small user base (<1K ratings) | -8% |
How we forecast this revenue
LOW CONFIDENCEBU Investment Matrix
Pre-traction · 39/100INDIE TIERlimited signal- 💰 Revenue: Marginal — $200 - $1250/mo · INDIE tier · medium confidence, trajectory unclear.
- ⭐ Quality: 3.97★ across 30 reviews — weak — significant quality concerns.
- 📍 Market: Not yet charting in any of the 9 monitored markets.
- 📈 Growth: last update 329d ago — slow cadence.
- ⚠️ Risk: Low — no material risk signals detected.
💰 Forecast Revenue / mo
MODEL| subscriptionREVIEW | +$2,500 | |
| highly recommendREVIEW | +$1,400 | |
| Ad-supported / freemiumMETRIC | +$600 | |
| Single-language (English only)METRIC | −$400 | |
| Pre-traction phase (30 ratings)METRIC | −$300 | |
| Growing app (2y old)METRIC | +$200 |
📈 Reviews Growth
LIVE⭐ Rating Trend
LIVEProfile & Insights
Identification
- App name
- The Best of Logan
- Developer
- Rise social LLC
- Bundle ID
- com.bestoflogan.logan
- App Store URL
- Open in App Store
- Category
- Shopping
- Content rating
- 4+
- Languages
- EN
Company
- Website
- Not found
- Tagline
- Today
- Description
- Find apps and games for iPhone, iPad, Mac, and more on the App Store.
- Founded
- Not found
- HQ / Address
- Not found
- Employees
- Not found
- Logo
- Available
Revenue
- Verified revenue / mo
- Not found
- AI revenue estimate / mo
- Not found
- AI annual estimate
- Not found
- ML model estimate / mo
- $22.7K/mo
- Top-grossing rank
- Outside top 100 in US Shopping
- All-time revenue
- Not found
- Pricing
- Not found
Founder
Funding
Press & Links
Contacts & Socials
📈Ratings growth30 ratings+900% lifetimeShow 3-year history estimate ▾
📝 About this app
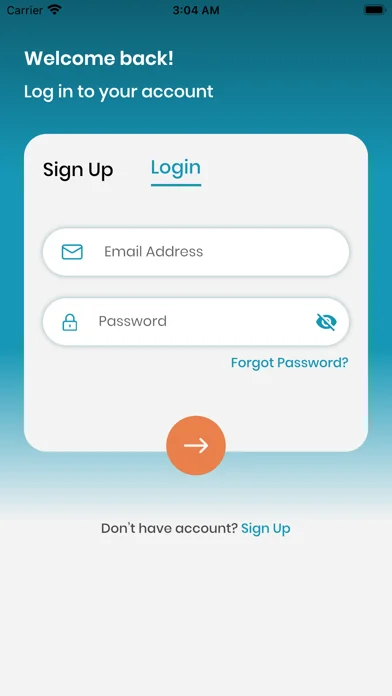
-Subscribe for $7.99 per month or $59.89 a year.
-Payment will be charged to your payment on file through your Apple ID.
-Subscription will automatically renew unless auto-renew has been turned off at least 24 hours before the renewal date.
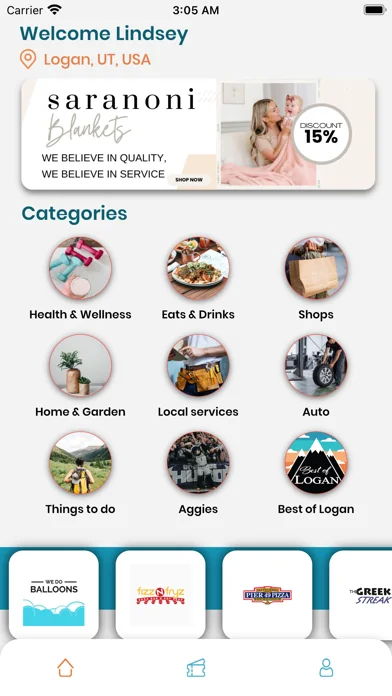
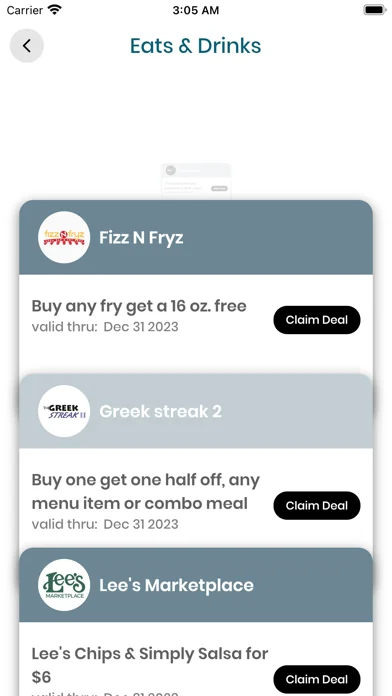
Enjoy discounts to many of your favorite local eateries, services, activities, and more through this app.… View full description on the official store →
What Worked™ · Development Pipeline
9 EVENTS TRACKEDMulti-Country Performance
Available in 9 of 9 monitored markets| Market | Rating | Reviews | Current version |
|---|---|---|---|
| 🇦🇺 AU | 0★ | 0 | — |
| 🇧🇷 BR | 0★ | 0 | — |
| 🇨🇦 CA | 0★ | 0 | — |
| 🇩🇪 DE | 0★ | 0 | — |
| 🇫🇷 FR | 0★ | 0 | — |
| 🇬🇧 GB | 0★ | 0 | — |
| 🇮🇳 IN | 5★ | 1 | 5★ this version |
| 🇯🇵 JP | 0★ | 0 | — |
| 🇺🇸 US | 3.96667★ | 30 | 3.96667★ this version |
Track this app’s revenue
FREE📝 Description
95


Why low confidence: only 30 ratings · no founder-verified revenue (model estimate only) · revenue figure is directional only.