Call of Duty®: Mobile
 89
89


Call of Duty®: Mobile
Activision’s mobile shooter targets the competitive FPS market, directly competing with titles like PUBG Mobile and Garena Free Fire. With over 13 million ratings averaging 4.5 stars, the app demonstrates significant, sustained traction, indicating a mature product in its growth cycle rather than an early-stage newcomer. This volume of positive feedback suggests a large, engaged user base that continues to find value in the game. As a free-to-play action title, the primary monetization observation for this category is the heavy reliance on in-app purchases for cosmetic items, battle passes, and character skins. These games typically see high revenue from a smaller percentage of highly engaged, paying users who invest in personalization and progression accelerators, rather than broad ad revenue or one-time purchases.
BU Score 89 · Excellent — strong product-market fit. The full Investment Matrix below scores 8 dimensions including monetisation, growth, and operational risk.
Track snapshot history and revenue forecast in the Performance section below.
- Title & subtitle keyword fit
- Description hook & conversion structure
- Screenshots, ratings, reviews strategy
📊 Performance Tracking LIVE
Synthetic estimate. Inputs: category complexity, file size, screen count, monetization layer, platform reach, age × team-size proxy. Calibrated against 2024-2026 indie-agency rate surveys. Full math + source list on /methodology.
| 🧱 MVP baseline (design + 1-store ship) | +$28K |
| 📱 5 unique screens × $4.5K | +$22K |
| 💎 In-app purchase plumbing | +$9K |
| ⚙ Action complexity ×2.20 | +$71K |
| 🌐 Cross-platform reach (iOS + Android) | +$71K |
Synthetic estimate. Multiple band derived from iap / freemium model + age, rating quality, category demand, and user-base maturity. Calibrated against 2024-2026 indie-app-marketplace closed-deal medians. Full math + comparable deal list on /methodology.
| 💎 IAP / freemium model base | 28× MRR |
| 🏷 Action category multiple | -15% |
| ⭐ Mature user base (1M+ ratings) | +8% |
Synthetic estimate from ratings × category benchmarks. Calibrated against 2024-2026 mobile-attribution retention + DAU/MAU reports. Numbers are US-storefront-equivalent — true global audience can be 5-10× larger for international apps. Full math + source list on /methodology.
| 📲 Action engagement | ~150 installs / rating |
| 🔁 Action D30 retention | 10% |
| 📍 DAU / MAU stickiness | 0.35 |
Heuristic guess from app bundle size, category, store description signals, and release-date stack era. Bumetric does not disassemble binaries — for binary-level certainty you would need an SDK intelligence tool or the manifest itself. Reasoning chain on the right. Full ruleset on /methodology.
| 🏷 Category context | Action |
| 📦 Tiny game bundle | → Native 2D engine |
How we forecast this revenue
MEDIUM CONFIDENCEBU Investment Matrix
Concerning · 55/100BIG TIERbelow benchmarks- 💰 Revenue: Healthy — $280K - $1540K/mo · BIG tier · medium-low confidence, trajectory unclear.
- ⭐ Quality: 4.26★ across 16,528,305 reviews — strong (top 10%).
- 📍 Market: Not yet charting in any of the 9 monitored markets.
- 📈 Growth: Insufficient signal to assess trajectory.
- ⚠️ Risk: Low — no material risk signals detected.
💰 Forecast Revenue / mo
MODEL| High install base (16,528,305 ratings)METRIC | +$12,000 | |
| 5 starREVIEW | +$1,800 | |
| Good rating (4.3★)METRIC | +$800 | |
| Established app (6y old)METRIC | +$800 | |
| Ad-supported / freemiumMETRIC | +$600 |
📈 Reviews Growth
LIVE⭐ Rating Trend
LIVEProfile & Insights
Identification
- App name
- Call of Duty®: Mobile
- Developer
- Activision Publishing, Inc.
- Bundle ID
- com.activision.callofduty.shooter
- App Store URL
- Open in App Store
- Category
- Action
- Content rating
- Not found
- Languages
- Not found
Company
- Website
- www.activision.com
- Tagline
- Not found
- Description
- Not found
- Founded
- Not found
- HQ / Address
- Not found
- Employees
- Not found
- Logo
- Not found
Revenue
- Verified revenue / mo
- Not found
- AI revenue estimate / mo
- Not found
- AI annual estimate
- Not found
- ML model estimate / mo
- $218/mo
- Top-grossing rank
- Not found
- All-time revenue
- Not found
- Pricing
- $0.99 - $99.99 per item
Founder
Funding
Press & Links
Contacts & Socials
📈Ratings growth16,528,305 ratings+43% lifetimeShow 3-year history estimate ▾
📝 About this app
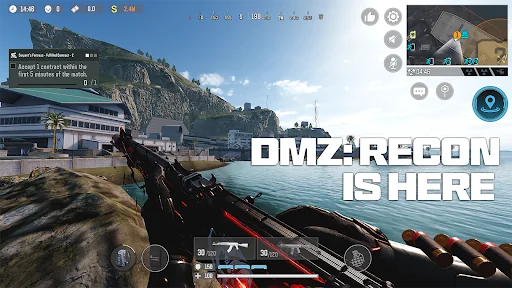
Battle on legendary maps from across the franchise, including Nuketown, Shipment, Rust, Terminal, Raid, Hijacked, and more. Fight with fan-favorite weapons from throughout Call of Duty history, featuring iconic firearms, perks, and equipment from multiple generations of Call of Duty games.… View full description on the official store →
Track this app’s revenue
FREE📝 Description
95


Why high confidence: 16,528,305 ratings · no founder-verified revenue (model estimate only).