1.2M Android Apps Tracked Updated 4 min ago Revenue Forecasts
Add an app Create Account Sign In
Home

Prime Video

83
Quality Score
Excellent

Prime Video

High confidence
4.4 ✍️ Editor
✍️ bumetric analysis

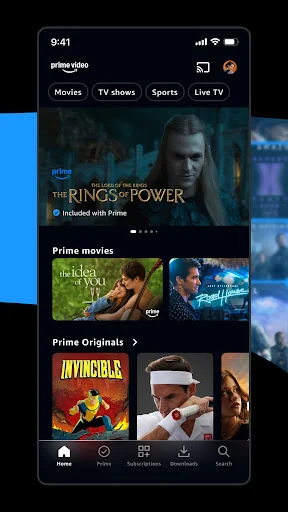
This app targets the premium streaming video market, directly competing with services like Netflix, Disney+, and HBO Max. Its strong user rating, backed by millions of reviews, signals established, large-scale traction. This isn't an early-stage app; it’s a mature product with significant market penetration, likely in a sustained growth or maintenance phase. The "free" monetization model is a misnomer here, as it functions as a gateway to the Amazon Prime subscription, which bundles video content with other services. For this entertainment category, a common monetization strategy involves tiered subscriptions offering varying content libraries or ad-free experiences. While direct per-download revenue isn't applicable, the app's success underscores the power of bundling and leveraging an existing ecosystem to drive subscription uptake.

BU Score 83 · Excellent — strong product-market fit. The full Investment Matrix below scores 8 dimensions including monetisation, growth, and operational risk.

Track snapshot history and revenue forecast in the Performance section below.

💰 Monthly revenue · now vs forecast
● Right now
$3.0M
per month
12-mo forecast
$3.2M – $4.9M
per month
24-mo forecast
$3.8M – $7.1M
per month
BIG tier
💡 Grow this revenue
Free AI audit of this app’s store listing
  • Title & subtitle keyword fit
  • Description hook & conversion structure
  • Screenshots, ratings, reviews strategy
Run free AI audit →
Typical impact: +2-5× organic installs
🔔Notify me when this app's revenue changes by

📊 Performance Tracking LIVE

Loading…
idle
0%
Rating
Reviews
Forecast Revenue / mo
Snapshots tracked
0
since first record
ONE-TIME · BUILD 💰 Estimated build cost
$120K
What it cost to build · not monthly revenue
Likely range $90K – $160K
$25K · MVP floor $100K · indie scale $500K+ · studio build
📈 Pays back in ~1.6y at current MRR

Synthetic estimate. Inputs: category complexity, file size, screen count, monetization layer, platform reach, age × team-size proxy. Calibrated against 2024-2026 indie-agency rate surveys. Full math + source list on /methodology.

Where the money goes
🧱 MVP baseline (design + 1-store ship) +$28K
📱 5 unique screens × $4.5K +$22K
💎 In-app purchase plumbing +$9K
Entertainment complexity ×1.30 +$17K
🌐 Cross-platform reach (iOS + Android) +$42K
Total estimate $120K
ONE-TIME · EXIT VALUE 💵 Estimated acquisition value
$200K
What it would sell for · not monthly revenue
Marketplace range $150K – $250K · 31× MRR multiple
💸 ~1.7× build cost (break-even+)

Synthetic estimate. Multiple band derived from iap / freemium model + age, rating quality, category demand, and user-base maturity. Calibrated against 2024-2026 indie-app-marketplace closed-deal medians. Full math + comparable deal list on /methodology.

How the multiple was built
💎 IAP / freemium model base 28× MRR
★ rating ≥ 4.4 (solid) +8%
🏷 Entertainment category multiple -5%
Mature user base (1M+ ratings) +8%
Final multiple 31× MRR
👥 Estimated audience size
801.0M
Lifetime downloads (US-equivalent)
Monthly active
96.0M
Daily active
38.0M

Synthetic estimate from ratings × category benchmarks. Calibrated against 2024-2026 mobile-attribution retention + DAU/MAU reports. Numbers are US-storefront-equivalent — true global audience can be 5-10× larger for international apps. Full math + source list on /methodology.

How we sized it
📲 Entertainment engagement ~150 installs / rating
🔁 Entertainment D30 retention 12%
📍 DAU / MAU stickiness 0.40
DAU / MAU 40% sticky
🔬

How we forecast this revenue

MEDIUM CONFIDENCE
Baseline
$3.0M/mo · ML-estimated from 234 triggers
Growth rate
+2.5% MoM · BIG tier baseline (compound monthly)
6 months
$3.0M – $4.0M
12 months
$3.2M – $4.9M
24 months
$3.8M – $7.1M
Compound growth at +2.5% MoM (tier baseline for BIG). Range widens with horizon — typical noise band ±15% at 6mo.. Ranges widen with horizon — distant futures carry more uncertainty.
📊

BU Investment Matrix

Mixed signals · 65/100BIG TIERcompetitive but cautious
RevenueQualityMarketGrowthMoatSafetyFounderMonetiz.
Revenue Strength
6.5
Product Quality
8.8
Market Position
0.0
Growth Velocity
5.0
Defensibility
9.7
Operational Safety
10.0
Founder Strength
7.3
Monetization Maturity
5.0
  • 💰 Revenue: Healthy — $1.2M - $6.6M/mo · BIG tier · medium-low confidence, trajectory unclear.
  • ⭐ Quality: 4.41★ across 5,340,004 reviews — strong (top 10%).
  • 📍 Market: Not yet charting in any of the 9 monitored markets.
  • 📈 Growth: Insufficient signal to assess trajectory.
  • ⚠️ Risk: Low — no material risk signals detected.
🎯 For competitors: Strong subscription moat. Hard to outcompete on retention. Better angle: free alternative with one-time purchase, or feature parity for an underserved sub-niche.
💵 For acquirers: Estimated asking range 18-32× monthly = $54.0M-$96.0M.
Composite of 8 dimensions computed deterministically from public signals — no LLM, every score traces back to a measurable input. Default weights shown; "compete" / "acquire" / "invest" lenses re-weight without re-fetching.
Range:

💰 Forecast Revenue / mo

MODEL
Revenue forecast computed from BU's 234 trigger model on each snapshot. Calibrated against ground-truth from 58 verified-revenue apps.
🔬Forecast Breakdown — Why This Estimate?Top 4 of 4 triggers
Our ML model uses 200+ signals from public data. These are the most influential for this app:
High install base (5,340,004 ratings)METRIC
+$12,000
Mature app (8y old)METRIC
+$1,500
Good rating (4.4★)METRIC
+$800
Ad-supported / freemiumMETRIC
+$600
METRIC = structural app data · REVIEW = mined from user reviews · ✓ VERIFIED = Stripe-verified anchor (TrustMRR)

📈 Reviews Growth

LIVE
Cumulative review count from first BU snapshot. Each point = a tracked update.

⭐ Rating Trend

LIVE
Average rating evolution. Updates with each new review batch.

Profile & Insights

Everything we know — and don't — about this app and its company.

Identification

App name
Prime Video
Developer
Amazon Mobile LLC
Bundle ID
com.amazon.avod.thirdpartyclient
App Store URL
Open in App Store
Category
Entertainment
Content rating
Not found
Languages
Not found

Company

Website
www.primevideo.com
Tagline
Not found
Description
Not found
Founded
Not found
HQ / Address
Not found
Employees
Not found
Logo
Not found

Revenue

Verified revenue / mo
Not found
AI revenue estimate / mo
Not found
AI annual estimate
Not found
ML model estimate / mo
$6.4K/mo
Top-grossing rank
Not found
All-time revenue
Not found
Pricing
$0.05 - $333.00 per item

Founder

Founder data not yet collected for this app.

Funding

Funding data not yet collected for this app.

Press & Links

Press & Links data not yet collected for this app.

Contacts & Socials

Contacts & Socials data not yet collected for this app.
📈Ratings growth5,340,004 ratings+42% lifetimeShow 3-year history estimate ▾Jul 2023Feb 2025Jul 2026
Tracked (1 weeks) Pre-tracking estimate (37 weeks) · model-based, ±5% noise · anchored to release date and current value
Profile is built from iTunes Lookup + developer site scrape + ML revenue model. Empty fields show "Not found" — additional sources (Crunchbase, X, IndieHackers, Acquire.com) coming.

📝 About this app

Watch movies, TV shows, live programming, and sports including Amazon MGM Studios-produced series and moviesRoad House, The Lord of the Rings: The Rings of Power, Fallout, Reacher, The Boys, and The Idea of You, and much more. Browse titles, search for your favorites, or enjoy movies and shows recommended just for you.

App features:
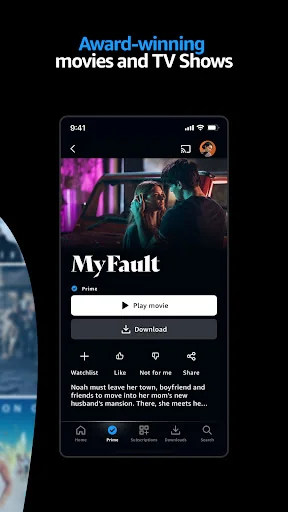
• Download videos to watch anywhere.
• Rent or buy new-release movies and popular TV shows (availability varies by marketplace).
• Cast from your phone or tablet to the big screen with Chromecast or FireTV.… View full description on the official store →
App Specs
🔐 Own this app? Claim & verify MRR →
🔖 vVaries with device🔄 updated 0d ago📂 Entertainment💰 Free📺 Ad-supported💎 IAP $0.05 - $333.00 per item
🔔

Track this app’s revenue

FREE
Get an email when revenue moves by your threshold. No spam, unsubscribe in one click.

📝 Description

95
BU Score · Transcendent
Full revenue analysis
Read the article-style breakdown for Prime Video: category rank, percentile, growth signal, comparable apps, and how the forecast is calibrated against verified-MRR anchors in this niche.
Read deep-dive →

More by Amazon Mobile LLC

View all →
📦 Portfolio summaryINDIE studio
38apps·$69K/mocombined
✓ Diversified — top app contributes 15%; risk spread across portfolio

Similar apps in Entertainment

About this analysis
ZCAnalyzed by Zakhar Chumak · founder, bumetric·Full methodology·High confidence

Why high confidence: 5,340,004 ratings · no founder-verified revenue (model estimate only).

Frequently Asked Questions

4 answers · auto-generated from this app's public data
How much does Prime Video make per month?
Based on our ML-calibrated revenue forecast, Prime Video earns approximately $6.4K/mo. This is a US-storefront-equivalent estimate; global revenue can be several times larger for internationally-distributed apps. See the methodology page for the full formula and confidence bands.
What apps are like Prime Video?
Browse the full Entertainment category catalog to find similar apps with revenue, build cost, audience and tech stack data. Each /p/{slug} page also shows a Compare side-by-side widget with three peer apps from the same niche.
Who makes Prime Video?
Prime Video is published by Amazon Mobile LLC on the Google Play Store. See the full publisher portfolio (other apps by the same developer) via the More by developer block on the product page above.
What is Prime Video's BU Score?
Prime Video has a BU Score of 83/100 (Excellent). The score combines App Store rating, ratings count, monetization model and revenue signals calibrated against founder-verified MRR anchors. See the BU Score formula.