1.2M Android Apps Tracked Updated 2 min ago Revenue Forecasts
Add an app Create Account Sign In
Home

Candy Crush Saga

94
Quality Score
Transcendent

Candy Crush Saga

High confidence
4.6 ✍️ Editor
✍️ bumetric analysis

Candy Crush Saga dominates the casual match-3 puzzle niche, directly competing with titles like Gardenscapes and Royal Match. Its 4.6-star rating across over 31 million reviews signals exceptional, sustained traction. This isn't a growth-stage app; it’s a mature, established market leader with a massive, loyal user base. The sheer volume of ratings indicates enduring popularity and strong user retention, translating to consistent, high-volume revenue. For free casual puzzle games, a common monetization observation is the heavy reliance on in-app purchases (IAPs) for power-ups and extra lives, often supplemented by optional rewarded video ads. The key is balancing player progression with strategic friction points that encourage IAP conversion without alienating the free player base.

BU Score 94 · Transcendent — category-leading momentum. The full Investment Matrix below scores 8 dimensions including monetisation, growth, and operational risk.

Track snapshot history and revenue forecast in the Performance section below.

💰 Monthly revenue · now vs forecast
● Right now
$700K
per month
12-mo forecast
$741K – $1141K
per month
24-mo forecast
$886K – $1645K
per month
BIG tier
💡 Grow this revenue
Free AI audit of this app’s store listing
  • Title & subtitle keyword fit
  • Description hook & conversion structure
  • Screenshots, ratings, reviews strategy
Run free AI audit →
Typical impact: +2-5× organic installs
🔔Notify me when this app's revenue changes by

📊 Performance Tracking LIVE

Loading…
idle
0%
Rating
Reviews
Forecast Revenue / mo
Snapshots tracked
0
since first record
ONE-TIME · BUILD 💰 Estimated build cost
$140K
What it cost to build · not monthly revenue
Likely range $105K – $190K
$25K · MVP floor $100K · indie scale $500K+ · studio build
📈 Pays back in ~10 months at current MRR

Synthetic estimate. Inputs: category complexity, file size, screen count, monetization layer, platform reach, age × team-size proxy. Calibrated against 2024-2026 indie-agency rate surveys. Full math + source list on /methodology.

Where the money goes
🧱 MVP baseline (design + 1-store ship) +$28K
📱 5 unique screens × $4.5K +$22K
💎 In-app purchase plumbing +$9K
Casual complexity ×1.50 +$29K
🌐 Cross-platform reach (iOS + Android) +$49K
Total estimate $140K
ONE-TIME · EXIT VALUE 💵 Estimated acquisition value
$375K
What it would sell for · not monthly revenue
Marketplace range $275K – $475K · 26× MRR multiple
💸 ~2.7× return on build cost

Synthetic estimate. Multiple band derived from iap / freemium model + age, rating quality, category demand, and user-base maturity. Calibrated against 2024-2026 indie-app-marketplace closed-deal medians. Full math + comparable deal list on /methodology.

How the multiple was built
💎 IAP / freemium model base 28× MRR
★ rating ≥ 4.4 (solid) +8%
🏷 Casual category multiple -22%
Mature user base (1M+ ratings) +8%
Final multiple 26× MRR
👥 Estimated audience size
8567.0M
Lifetime downloads (US-equivalent)
Monthly active
514.0M
Daily active
179.5M

Synthetic estimate from ratings × category benchmarks. Calibrated against 2024-2026 mobile-attribution retention + DAU/MAU reports. Numbers are US-storefront-equivalent — true global audience can be 5-10× larger for international apps. Full math + source list on /methodology.

How we sized it
📲 Casual engagement ~220 installs / rating
🔁 Casual D30 retention 6%
📍 DAU / MAU stickiness 0.35
DAU / MAU 35% sticky
🛠 Estimated tech stack
🤖
Native Android (Kotlin)
Medium confidence · 55%
Also possible
Flutter

Heuristic guess from app bundle size, category, store description signals, and release-date stack era. Bumetric does not disassemble binaries — for binary-level certainty you would need an SDK intelligence tool or the manifest itself. Reasoning chain on the right. Full ruleset on /methodology.

Signals we read
🏷 Category context Casual
📦 Tiny game bundle → Native 2D engine
🔬

How we forecast this revenue

MEDIUM CONFIDENCE
Baseline
$700K/mo · ML-estimated from 234 triggers
Growth rate
+2.5% MoM · BIG tier baseline (compound monthly)
6 months
$690K – $933K
12 months
$741K – $1.1M
24 months
$886K – $1.6M
Compound growth at +2.5% MoM (tier baseline for BIG). Range widens with horizon — typical noise band ±15% at 6mo.. Ranges widen with horizon — distant futures carry more uncertainty.
📊

BU Investment Matrix

Concerning · 54/100BIG TIERbelow benchmarks
GrowthFounderQualityRevenueMonetiz.MoatMarketSafety
Growth Velocity
5.0
Founder Strength
7.4
Product Quality
9.2
Revenue Strength
5.8
Monetization Maturity
1.0
Defensibility
5.0
Market Position
0.0
Operational Safety
10.0
  • 💰 Revenue: Healthy — $280K - $1540K/mo · BIG tier · medium-low confidence, trajectory unclear.
  • ⭐ Quality: 4.6★ across 31,476,637 reviews — exceptional (top 1% in category).
  • 📍 Market: Not yet charting in any of the 9 monitored markets.
  • 📈 Growth: Insufficient signal to assess trajectory.
  • ⚠️ Risk: Low — no material risk signals detected.
🎯 For competitors: Mixed picture. Worth competing if you have a clear UX or pricing edge — otherwise crowded segment.
💵 For acquirers: Estimated asking range 18-32× monthly = $12.6M-$22.4M.
Composite of 8 dimensions computed deterministically from public signals — no LLM, every score traces back to a measurable input. Default weights shown; "compete" / "acquire" / "invest" lenses re-weight without re-fetching.
Range:

💰 Forecast Revenue / mo

MODEL
Revenue forecast computed from BU's 234 trigger model on each snapshot. Calibrated against ground-truth from 58 verified-revenue apps.
🔬Forecast Breakdown — Why This Estimate?Top 4 of 4 triggers
Our ML model uses 200+ signals from public data. These are the most influential for this app:
High install base (38,942,188 ratings)METRIC
+$12,000
Excellent rating (4.6★)METRIC
+$2,200
Mature app (13y old)METRIC
+$1,500
Ad-supported / freemiumMETRIC
+$600
METRIC = structural app data · REVIEW = mined from user reviews · ✓ VERIFIED = Stripe-verified anchor (TrustMRR)

📈 Reviews Growth

LIVE
Cumulative review count from first BU snapshot. Each point = a tracked update.

⭐ Rating Trend

LIVE
Average rating evolution. Updates with each new review batch.

Profile & Insights

Everything we know — and don't — about this app and its company.

Identification

App name
Candy Crush Saga
Developer
King
Bundle ID
com.king.candycrushsaga
App Store URL
Open in App Store
Category
Casual
Content rating
Not found
Languages
Not found

Company

Website
candycrushsaga.com
Tagline
Not found
Description
Not found
Founded
Not found
HQ / Address
Not found
Employees
Not found
Logo
Not found

Revenue

Verified revenue / mo
Not found
AI revenue estimate / mo
Not found
AI annual estimate
Not found
ML model estimate / mo
$14.3K/mo
Top-grossing rank
Not found
All-time revenue
Not found
Pricing
$0.99 - $149.99 per item

Founder

Founder data not yet collected for this app.

Funding

Funding data not yet collected for this app.

Press & Links

Press & Links data not yet collected for this app.

Contacts & Socials

Contacts & Socials data not yet collected for this app.
AI Revenue EstimateCONFIDENCE: LOW
Publicly available sources provide revenue estimates for the overall Candy Crush Saga mobile game (iOS and Android combined), but specific global revenue figures solely for the Android app are not precisely delineated. While some regional Google Play revenue data exists, a comprehensive global Android-only estimate is not available from the provided sources.
Sources mentioned: Sensor Tower, Statista, Adapty, Reddit, Wikipedia, Juego Studios, Owler Company Profile, Business of Apps, Priori Data, App2top
📈Ratings growth38,942,188 ratings+32% lifetimeShow 3-year history estimate ▾Jun 2023Dec 2024Jun 2026
Tracked (1 weeks) Pre-tracking estimate (36 weeks) · model-based, ±5% noise · anchored to release date and current value
Profile is built from iTunes Lookup + developer site scrape + ML revenue model. Empty fields show "Not found" — additional sources (Crunchbase, X, IndieHackers, Acquire.com) coming.

📝 About this app

Candy Crush Saga is a bright, feel-good matching escape packed with colorful surprises, satisfying combos, and sweet moments of progress. Dive into a world of candy-coated challenges where every move can spark a delicious chain reaction. From quick relaxing breaks to longer play sessions, this playful puzzle adventure turns simple match 3 into pure fun.

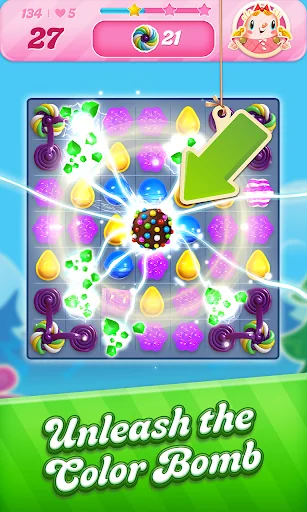
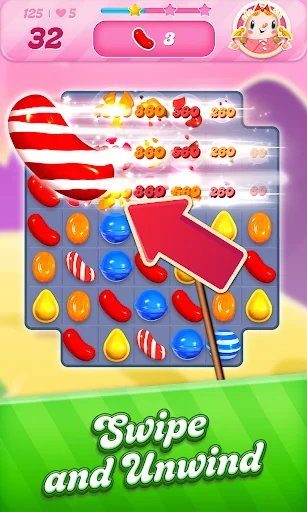
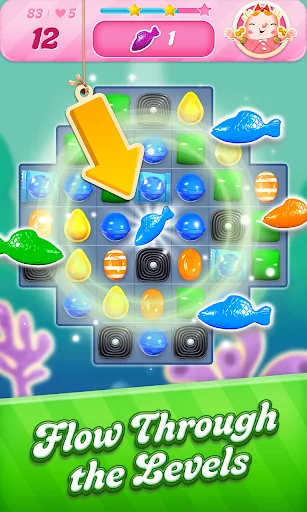
🍬 Why players keep coming back
Thousands of levels, creative obstacles, and candy-filled charm make every session easy to start and hard to put down.… View full description on the official store →
App Specs
🔐 Own this app? Claim & verify MRR →
🔖 v1.329.0.1🔄 updated 0d ago📂 Casual💰 Free📺 Ad-supported💎 IAP $0.99 - $149.99 per item
🔔

Track this app’s revenue

FREE
Get an email when revenue moves by your threshold. No spam, unsubscribe in one click.

📝 Description

95
BU Score · Transcendent
Full revenue analysis
Read the article-style breakdown for Candy Crush Saga: category rank, percentile, growth signal, comparable apps, and how the forecast is calibrated against verified-MRR anchors in this niche.
Read deep-dive →

More by King

View all →
📦 Portfolio summaryINDIE studio
12apps·$82K/mocombined
✓ Diversified — top app contributes 17%; risk spread across portfolio

Similar apps in Casual

About this analysis
ZCAnalyzed by Zakhar Chumak · founder, bumetric·Full methodology·High confidence

Why high confidence: 38,942,188 ratings · no founder-verified revenue (model estimate only).

Frequently Asked Questions

4 answers · auto-generated from this app's public data
How much does Candy Crush Saga make per month?
Based on our ML-calibrated revenue forecast, Candy Crush Saga earns approximately $14K/mo. This is a US-storefront-equivalent estimate; global revenue can be several times larger for internationally-distributed apps. See the methodology page for the full formula and confidence bands.
What apps are like Candy Crush Saga?
Browse the full Casual category catalog to find similar apps with revenue, build cost, audience and tech stack data. Each /p/{slug} page also shows a Compare side-by-side widget with three peer apps from the same niche.
Who makes Candy Crush Saga?
Candy Crush Saga is published by King on the Google Play Store. See the full publisher portfolio (other apps by the same developer) via the More by developer block on the product page above.
What is Candy Crush Saga's BU Score?
Candy Crush Saga has a BU Score of 94/100 (Transcendent). The score combines App Store rating, ratings count, monetization model and revenue signals calibrated against founder-verified MRR anchors. See the BU Score formula.