1.1M Android Apps Tracked Updated just now Revenue Forecasts
Create Account Sign In
Home

OLX: Buy & Sell Near You

82
Quality Score
Excellent

OLX: Buy & Sell Near You

High confidence
4.4 ✍️ Editor
✍️ bumetric analysis

This Android app carves out a strong niche in the C2C classifieds market, specifically for used goods and services in India, directly competing with platforms like Quikr and local Facebook Marketplace groups. Its substantial user rating, reflecting millions of reviews, signals robust user traction and a mature product in the growth stage, indicating a well-established user base and consistent engagement. While the app is free, its revenue model likely relies on premium listing features for sellers, promoted ads, or potentially lead generation services for specific categories like real estate or automotive. In this category, a common monetization observation is the significant revenue potential from in-app promotions and visibility boosts for sellers, often outperforming traditional display advertising due to higher conversion rates for motivated users.

BU Score 82 · Excellent — strong product-market fit. The full Investment Matrix below scores 8 dimensions including monetisation, growth, and operational risk.

Track snapshot history and revenue forecast in the Performance section below.

💰 Monthly revenue · now vs forecast
● Right now
$6.4K
per month
12-mo forecast
$6.6K – $13.9K
per month
24-mo forecast
$8.2K – $24.7K
per month
MID tier
💡 Grow this revenue
Free AI audit of this app’s store listing
  • Title & subtitle keyword fit
  • Description hook & conversion structure
  • Screenshots, ratings, reviews strategy
Run free AI audit →
Typical impact: +2-5× organic installs
🔔Notify me when this app's revenue changes by

📊 Performance Tracking LIVE

Loading…
idle
0%
Rating
Reviews
Forecast Revenue / mo
Snapshots tracked
0
since first record
ONE-TIME · BUILD 💰 Estimated build cost
$100K
What it cost to build · not monthly revenue
Likely range $75K – $135K
$25K · MVP floor $100K · indie scale $500K+ · studio build
📈 Pays back in ~1.3y at current MRR

Synthetic estimate. Inputs: category complexity, file size, screen count, monetization layer, platform reach, age × team-size proxy. Calibrated against 2024-2026 indie-agency rate surveys. Full math + source list on /methodology.

Where the money goes
🧱 MVP baseline (design + 1-store ship) +$28K
📱 5 unique screens × $4.5K +$22K
Shopping complexity ×1.30 +$15K
🌐 Cross-platform reach (iOS + Android) +$36K
Total estimate $100K
ONE-TIME · EXIT VALUE 💵 Estimated acquisition value
$125K
What it would sell for · not monthly revenue
Marketplace range $75K – $150K · 18× MRR multiple
💸 ~1.2× build cost (break-even+)

Synthetic estimate. Multiple band derived from ad-supported + age, rating quality, category demand, and user-base maturity. Calibrated against 2024-2026 indie-app-marketplace closed-deal medians. Full math + comparable deal list on /methodology.

How the multiple was built
📺 Ad-supported base 15× MRR
★ rating ≥ 4.4 (solid) +8%
🏷 Shopping category multiple +2%
Mature user base (1M+ ratings) +8%
Final multiple 18× MRR
👥 Estimated audience size
316.0M
Lifetime downloads (US-equivalent)
Monthly active
37.5M
Daily active
6.8M

Synthetic estimate from ratings × category benchmarks. Calibrated against 2024-2026 mobile-attribution retention + DAU/MAU reports. Numbers are US-storefront-equivalent — true global audience can be 5-10× larger for international apps. Full math + source list on /methodology.

How we sized it
📲 Shopping engagement ~100 installs / rating
🔁 Shopping D30 retention 12%
📍 DAU / MAU stickiness 0.18
DAU / MAU 18% sticky
🛠 Estimated tech stack
🤖
Native Android (Kotlin)
High confidence · 80%
Also possible
Flutter

Heuristic guess from app bundle size, category, store description signals, and release-date stack era. Bumetric does not disassemble binaries — for binary-level certainty you would need an SDK intelligence tool or the manifest itself. Reasoning chain on the right. Full ruleset on /methodology.

Signals we read
🏷 Category context Shopping
📦 Compact Android bundle → Native Kotlin
🔬

How we forecast this revenue

MEDIUM CONFIDENCE
Baseline
$6.4K/mo · ML-estimated from 234 triggers
Growth rate
+4.0% MoM · MID tier baseline (compound monthly)
Direction
Headwinds: low defensibility moat
6 months
$6.1K – $10.2K
12 months
$6.6K – $13.9K
24 months
$8.2K – $24.7K
Compound growth at +4.0% MoM (tier baseline for MID). Range widens with horizon — typical noise band ±25% at 6mo.. Ranges widen with horizon — distant futures carry more uncertainty.
📊

BU Investment Matrix

Below median · 44/100MID TIERunderperforming peers
GrowthFounderQualityRevenueMonetiz.MoatMarketSafety
Growth Velocity
5.0
Founder Strength
4.8
Product Quality
8.8
Revenue Strength
3.8
Monetization Maturity
1.0
Defensibility
2.0
Market Position
0.0
Operational Safety
10.0
  • 💰 Revenue: Modest — $4K - $9K/mo · MID tier · medium confidence, trajectory unclear.
  • ⭐ Quality: 4.41★ across 3,161,706 reviews — strong (top 10%).
  • 📍 Market: Not yet charting in any of the 9 monitored markets.
  • 📈 Growth: Insufficient signal to assess trajectory.
  • ⚠️ Risk: Low — no material risk signals detected.
🎯 For competitors: Mixed picture. Worth competing if you have a clear UX or pricing edge — otherwise crowded segment.
💵 For acquirers: Estimated asking range 18-32× monthly = $115K-$205K.
Composite of 8 dimensions computed deterministically from public signals — no LLM, every score traces back to a measurable input. Default weights shown; "compete" / "acquire" / "invest" lenses re-weight without re-fetching.
Range:

💰 Forecast Revenue / mo

MODEL
Revenue forecast computed from BU's 234 trigger model on each snapshot. Calibrated against ground-truth from 58 verified-revenue apps.
🔬Forecast Breakdown — Why This Estimate?Top 3 of 3 triggers
Our ML model uses 200+ signals from public data. These are the most influential for this app:
High install base (3,161,706 ratings)METRIC
+$12,000
Good rating (4.4★)METRIC
+$800
Ad-supported / freemiumMETRIC
+$600
METRIC = structural app data · REVIEW = mined from user reviews · ✓ VERIFIED = Stripe-verified anchor (TrustMRR)

📈 Reviews Growth

LIVE
Cumulative review count from first BU snapshot. Each point = a tracked update.

⭐ Rating Trend

LIVE
Average rating evolution. Updates with each new review batch.

Profile & Insights

Everything we know — and don't — about this app and its company.

Identification

App name
OLX: Buy & Sell Near You
Developer
Sobek Auto India Private Limited
Bundle ID
com.olx.southasia
App Store URL
Open in App Store
Category
Shopping
Content rating
Not found
Languages
Not found

Company

Website
Not found
Tagline
Not found
Description
Not found
Founded
Not found
HQ / Address
Not found
Employees
Not found
Logo
Not found

Revenue

Verified revenue / mo
Not found
AI revenue estimate / mo
$2.0M ($1.7M – $2.3M)AI medium
AI annual estimate
$23.8M/yr
ML model estimate / mo
$6.4K/mo
Top-grossing rank
Not found
All-time revenue
Not found
Pricing
Not found

Founder

Founder data not yet collected for this app.

Funding

Funding data not yet collected for this app.

Press & Links

Press & Links data not yet collected for this app.

Contacts & Socials

Contacts & Socials data not yet collected for this app.
AI Revenue EstimateCONFIDENCE: MEDIUM
OLX India, operated by Sobek Auto India Private Limited, generated an annual revenue of approximately $23.84 million for the financial year ending March 31, 2025. This translates to an estimated monthly revenue of around $1.99 million, with projections indicating continued growth.
Sources mentioned: Tracxn, Tofler, YourStory, TipRanks.com, CarTrade Tech Ltd
Profile is built from iTunes Lookup + developer site scrape + ML revenue model. Empty fields show "Not found" — additional sources (Crunchbase, X, IndieHackers, Acquire.com) coming.

📝 About this app

🚀 Buy, sell, and rent used goods near you 🤑

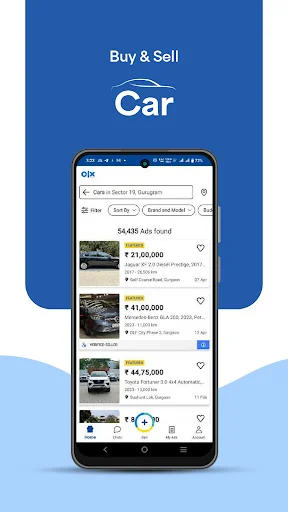
Explore cars, bikes, real estate, and more in cities like Delhi NCR, Mumbai, Bengaluru, Hyderabad, Kerala, and many more.

Reach out to more than 3.5 crore buyers to find a new home for your pre-owned goods and services and get the best price💰

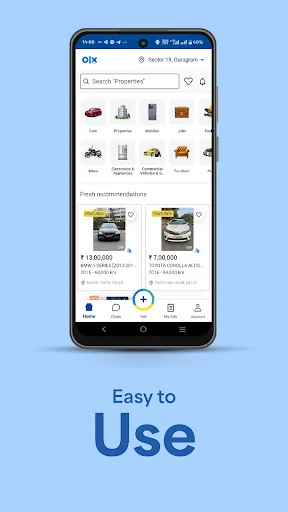
Browse from a wide range of products and services with real photos, selling price, location and detailed owner descriptions across multiple categories 📸

Easily search, sort, and filter by location, price, and relevance 🔍

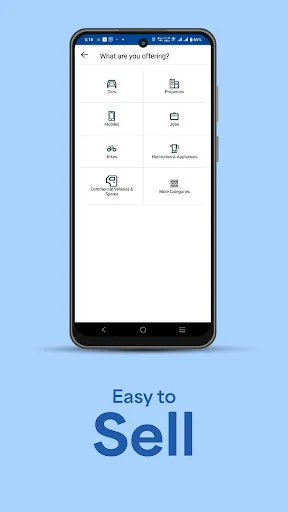
Explore categories like:

🚗 Cars: Buy & sell used cars on OLX.… View full description on the official store →
App Specs
🔐 Own this app? Claim & verify MRR →
🔖 vVaries with device📂 Shopping💰 Free
🔔

Track this app’s revenue

FREE
Get an email when revenue moves by your threshold. No spam, unsubscribe in one click.

📝 Description

95
BU Score · Transcendent
Full revenue analysis
Read the article-style breakdown for OLX: Buy & Sell Near You: category rank, percentile, growth signal, comparable apps, and how the forecast is calibrated against verified-MRR anchors in this niche.
Read deep-dive →

Similar apps in Shopping

About this analysis
ZCAnalyzed by Zakhar Chumak · founder, bumetric·Full methodology·High confidence

Why high confidence: 3,161,706 ratings · no founder-verified revenue (model estimate only).

Frequently Asked Questions

4 answers · auto-generated from this app's public data
How much does OLX make per month?
Based on our ML-calibrated revenue forecast, OLX earns approximately $6.4K/mo. This is a US-storefront-equivalent estimate; global revenue can be several times larger for internationally-distributed apps. See the methodology page for the full formula and confidence bands.
What apps are like OLX?
Browse the full Shopping category catalog to find similar apps with revenue, build cost, audience and tech stack data. Each /p/{slug} page also shows a Compare side-by-side widget with three peer apps from the same niche.
Who makes OLX?
OLX is published by Sobek Auto India Private Limited on the Google Play Store. See the full publisher portfolio (other apps by the same developer) via the More by developer block on the product page above.
What is OLX's BU Score?
OLX has a BU Score of 82/100 (Excellent). The score combines App Store rating, ratings count, monetization model and revenue signals calibrated against founder-verified MRR anchors. See the BU Score formula.