Partender – Fast Bar Inventory


 53
53


Partender – Fast Bar Inventory
Partender – Fast Bar Inventory is an Android app from Partender Inc in the Business category, currently rated 4.1★ across 341 ratings. Initial signal reads as mixed reviews: supporters praise core features while critics cite stability and value gaps.
Quality Score is 53: Solid (established niche player). For a Business app, that means established niche player. The full BU Investment Matrix below scores 8 dimensions including monetisation, growth, and operational risk.
Track changes month-over-month in the Performance section below: live snapshot history and revenue forecast included.
- Title & subtitle keyword fit
- Description hook & conversion structure
- Screenshots, ratings, reviews strategy
📊 Performance Tracking LIVE
Synthetic estimate. Inputs: category complexity, file size, screen count, monetization layer, platform reach, age × team-size proxy. Calibrated against 2024-2026 indie-agency rate surveys. Full math + source list on /methodology.
| 🧱 MVP baseline (design + 1-store ship) | +$28K |
| 📱 5 unique screens × $4.5K | +$22K |
| ⚙ Business complexity ×1.50 | +$25K |
| 🌐 Cross-platform reach (iOS + Android) | +$41K |
Synthetic estimate from ratings × category benchmarks. Calibrated against 2024-2026 mobile-attribution retention + DAU/MAU reports. Numbers are US-storefront-equivalent — true global audience can be 5-10× larger for international apps. Full math + source list on /methodology.
| 📲 Business engagement | ~65 installs / rating |
| 🔁 Business D30 retention | 22% |
| 📍 DAU / MAU stickiness | 0.30 |
How we forecast this revenue
LOW CONFIDENCEBU Investment Matrix
Pre-traction · 37/100INDIE TIERlimited signal- 💰 Revenue: Marginal — $200 - $1250/mo · INDIE tier · medium confidence, trajectory unclear.
- ⭐ Quality: 4.08★ across 341 reviews — below category median.
- 📍 Market: Not yet charting in any of the 9 monitored markets.
- 📈 Growth: ⚠ last update 805d ago — possibly dormant.
- ⚠️ Risk: Moderate — dormant (805d since update).
💰 Forecast Revenue / mo
MODEL| Mature app (11y old)METRIC | +$1,500 | |
| Good rating (4.1★)METRIC | +$800 | |
| Ad-supported / freemiumMETRIC | +$600 | |
| Early-stage install base (341 ratings)METRIC | +$400 |
📈 Reviews Growth
LIVE⭐ Rating Trend
LIVEProfile & Insights
Identification
- App name
- Partender – Fast Bar Inventory
- Developer
- Partender Inc
- Bundle ID
- com.partender.android
- App Store URL
- Open in App Store
- Category
- Business
- Content rating
- Not found
- Languages
- Not found
Company
- Website
- app.partender.com
- Tagline
- Not found
- Description
- Not found
- Founded
- Not found
- HQ / Address
- Not found
- Employees
- Not found
- Logo
- Not found
Revenue
- Verified revenue / mo
- Not found
- AI revenue estimate / mo
- Not found
- AI annual estimate
- Not found
- ML model estimate / mo
- $302/mo
- Top-grossing rank
- Not found
- All-time revenue
- Not found
- Pricing
- Not found
Founder
Funding
Press & Links
Contacts & Socials
📈Ratings growth341 ratings+25% lifetimeShow 3-year history estimate ▾
📝 About this app
- Do full, physical bar inventory in just 15 minutes and with up to 99.2% accuracy
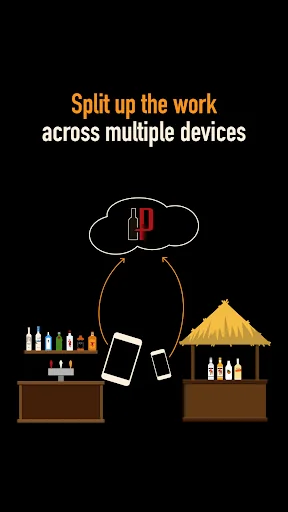
- Split up the work across as many users as you'd like on iOS, Android, and even the web
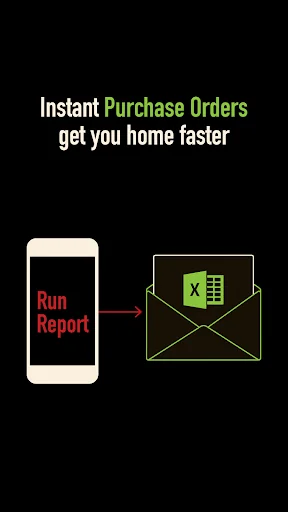
- Generate editable "Smart Orders" based on what you actually went through
- Place, track, and receive those orders online
- Get alerted when prices change
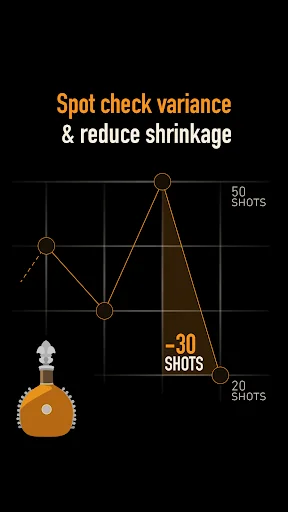
- Get your Usage (for Variance)
- Get your Actual Cost of Goods Sold (COGS for Bev Cost %)… View full description on the official store →
Track this app’s revenue
FREE📝 Description
95


Why medium confidence: 341 ratings · no founder-verified revenue (model estimate only).