Urban Company: InstaHelp &more


 85
85


Urban Company provides on-demand home services, directly competing with local service aggregators and individual contractors for everything from cleaning to appliance repair. The substantial volume of ratings, coupled with a high average score, indicates significant user traction and strong market penetration. This app is clearly past its early growth phase, operating at scale with established demand. Given the "House & Home" category, a common monetization observation is the reliance on service commissions or subscription models for frequent users. While the app itself is free, revenue is generated through a percentage of each service booked, or potentially through premium tiers offering priority booking or specialized professionals. The high user engagement suggests a robust pipeline for converting free users into paying service consumers.
BU Score 85 · Excellent — strong product-market fit. The full Investment Matrix below scores 8 dimensions including monetisation, growth, and operational risk.
Track snapshot history and revenue forecast in the Performance section below.
- Title & subtitle keyword fit
- Description hook & conversion structure
- Screenshots, ratings, reviews strategy
📊 Performance Tracking LIVE
Synthetic estimate. Inputs: category complexity, file size, screen count, monetization layer, platform reach, age × team-size proxy. Calibrated against 2024-2026 indie-agency rate surveys. Full math + source list on /methodology.
| 🧱 MVP baseline (design + 1-store ship) | +$28K |
| 📱 5 unique screens × $4.5K | +$22K |
| 🌐 Cross-platform reach (iOS + Android) | +$27K |
Synthetic estimate. Multiple band derived from ad-supported + age, rating quality, category demand, and user-base maturity. Calibrated against 2024-2026 indie-app-marketplace closed-deal medians. Full math + comparable deal list on /methodology.
| 📺 Ad-supported base | 15× MRR |
| ⭐ ★ rating ≥ 4.7 (premium) | +15% |
| 🏷 House & Home category multiple | -5% |
| ⭐ Mature user base (1M+ ratings) | +8% |
Synthetic estimate from ratings × category benchmarks. Calibrated against 2024-2026 mobile-attribution retention + DAU/MAU reports. Numbers are US-storefront-equivalent — true global audience can be 5-10× larger for international apps. Full math + source list on /methodology.
| 📲 House & Home engagement | ~160 installs / rating |
| 🔁 House & Home D30 retention | 12% |
| 📍 DAU / MAU stickiness | 0.12 |
How we forecast this revenue
MEDIUM CONFIDENCEBU Investment Matrix
Below median · 49/100MID TIERunderperforming peers- 💰 Revenue: Modest — $4K - $9K/mo · MID tier · medium confidence, trajectory unclear.
- ⭐ Quality: 4.82★ across 2,001,606 reviews — exceptional (top 1% in category).
- 📍 Market: Not yet charting in any of the 9 monitored markets.
- 📈 Growth: Insufficient signal to assess trajectory.
- ⚠️ Risk: Low — no material risk signals detected.
💰 Forecast Revenue / mo
MODEL| High install base (2,001,606 ratings)METRIC | +$12,000 | |
| Excellent rating (4.8★)METRIC | +$2,200 | |
| 5 starREVIEW | +$1,800 | |
| cancelledREVIEW | −$1,500 | |
| Mature app (11y old)METRIC | +$1,500 | |
| highly recommendREVIEW | +$1,400 | |
| Ad-supported / freemiumMETRIC | +$600 |
📈 Reviews Growth
LIVE⭐ Rating Trend
LIVEProfile & Insights
Identification
- App name
- Urban Company: InstaHelp &more
- Developer
- Urban Company
- Bundle ID
- com.urbanclap.urbanclap
- App Store URL
- Open in App Store
- Category
- House & Home
- Content rating
- Not found
- Languages
- Not found
Company
- Website
- www.urbancompany.com
- Tagline
- Not found
- Description
- Not found
- Founded
- Not found
- HQ / Address
- Not found
- Employees
- Not found
- Logo
- Not found
Revenue
- Verified revenue / mo
- Not found
- AI revenue estimate / mo
- Not found
- AI annual estimate
- Not found
- ML model estimate / mo
- $270/mo
- Top-grossing rank
- Not found
- All-time revenue
- Not found
- Pricing
- Not found
Founder
Funding
Press & Links
Contacts & Socials
📈Ratings growth2,001,606 ratings+14% lifetimeShow 3-year history estimate ▾
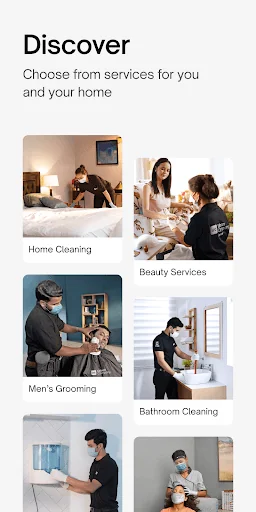
📝 About this app
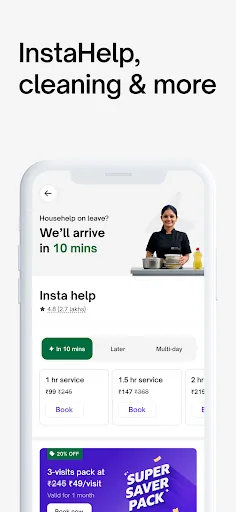
Insta Help:
Househelp on leave? Get househelp in 15 minutes, trained to be a home cleaner, housekeeper, and even a meal-prep assistant. Join the 20k+ happy customers serviced by our 4.7+ rated professionals.… View full description on the official store →
What Worked™ · Development Pipeline
3 EVENTS TRACKEDTrack this app’s revenue
FREE📝 Description
95
More by Urban Company
View all →


Why high confidence: 2,001,606 ratings · no founder-verified revenue (model estimate only).