1.2M Android Apps Tracked Updated 1 min ago Revenue Forecasts
Add an app Create Account Sign In
Home

Zillow: Homes for Sale & Rent

84
Quality Score
Excellent

Zillow: Homes for Sale & Rent

High confidence
4.8 ✍️ Editor
✍️ bumetric analysis

Zillow: Homes for Sale & Rent is an Android app from Zillow Group in the House & Home category, currently rated 4.8★ across 1,615,301 ratings. Initial signal reads as mostly critical sentiment so far: users flag rough edges and unmet expectations.

Quality Score is 84: Excellent (strong product-market fit). For a House & Home app, that means strong product-market fit. The full BU Investment Matrix below scores 8 dimensions including monetisation, growth, and operational risk.

Track changes month-over-month in the Performance section below: live snapshot history and revenue forecast included.

💰 Monthly revenue · now vs forecast
● Right now
$5.7K
per month
12-mo forecast
$5.9K – $12.3K
per month
24-mo forecast
$7.3K – $21.8K
per month
MID tier
💡 Grow this revenue
Free AI audit of this app’s store listing
  • Title & subtitle keyword fit
  • Description hook & conversion structure
  • Screenshots, ratings, reviews strategy
Run free AI audit →
Typical impact: +2-5× organic installs
🔔Notify me when this app's revenue changes by

📊 Performance Tracking LIVE

Loading…
idle
0%
Rating
Reviews
Forecast Revenue / mo
Snapshots tracked
0
since first record
ONE-TIME · BUILD 💰 Estimated build cost
$80K
What it cost to build · not monthly revenue
Likely range $60K – $110K
$25K · MVP floor $100K · indie scale $500K+ · studio build
📈 Pays back in ~1.2y at current MRR

Synthetic estimate. Inputs: category complexity, file size, screen count, monetization layer, platform reach, age × team-size proxy. Calibrated against 2024-2026 indie-agency rate surveys. Full math + source list on /methodology.

Where the money goes
🧱 MVP baseline (design + 1-store ship) +$28K
📱 5 unique screens × $4.5K +$22K
🌐 Cross-platform reach (iOS + Android) +$27K
Total estimate $80K
ONE-TIME · EXIT VALUE 💵 Estimated acquisition value
$100K
What it would sell for · not monthly revenue
Marketplace range $75K – $125K · 18× MRR multiple
💸 ~1.2× build cost (break-even+)

Synthetic estimate. Multiple band derived from ad-supported + age, rating quality, category demand, and user-base maturity. Calibrated against 2024-2026 indie-app-marketplace closed-deal medians. Full math + comparable deal list on /methodology.

How the multiple was built
📺 Ad-supported base 15× MRR
★ rating ≥ 4.7 (premium) +15%
🏷 House & Home category multiple -5%
Mature user base (1M+ ratings) +8%
Final multiple 18× MRR
👥 Estimated audience size
258.0M
Lifetime downloads (US-equivalent)
Monthly active
30.5M
Daily active
3.6M

Synthetic estimate from ratings × category benchmarks. Calibrated against 2024-2026 mobile-attribution retention + DAU/MAU reports. Numbers are US-storefront-equivalent — true global audience can be 5-10× larger for international apps. Full math + source list on /methodology.

How we sized it
📲 House & Home engagement ~160 installs / rating
🔁 House & Home D30 retention 12%
📍 DAU / MAU stickiness 0.12
DAU / MAU 12% sticky
🔬

How we forecast this revenue

MEDIUM CONFIDENCE
Baseline
$5.7K/mo · ML-estimated from 234 triggers
Growth rate
+4.0% MoM · MID tier baseline (compound monthly)
6 months
$5.4K – $9.0K
12 months
$5.9K – $12.3K
24 months
$7.3K – $21.8K
Compound growth at +4.0% MoM (tier baseline for MID). Range widens with horizon — typical noise band ±25% at 6mo.. Ranges widen with horizon — distant futures carry more uncertainty.
📊

BU Investment Matrix

Below median · 50/100MID TIERunderperforming peers
GrowthFounderQualityRevenueMonetiz.MoatMarketSafety
Growth Velocity
5.0
Founder Strength
4.9
Product Quality
9.6
Revenue Strength
3.8
Monetization Maturity
1.0
Defensibility
6.0
Market Position
0.0
Operational Safety
10.0
  • 💰 Revenue: Modest — $3K - $8K/mo · MID tier · medium confidence, trajectory unclear.
  • ⭐ Quality: 4.78★ across 1,615,301 reviews — exceptional (top 1% in category).
  • 📍 Market: Not yet charting in any of the 9 monitored markets.
  • 📈 Growth: Insufficient signal to assess trajectory.
  • ⚠️ Risk: Low — no material risk signals detected.
🎯 For competitors: Mixed picture. Worth competing if you have a clear UX or pricing edge — otherwise crowded segment.
💵 For acquirers: Estimated asking range 18-32× monthly = $101K-$181K.
Composite of 8 dimensions computed deterministically from public signals — no LLM, every score traces back to a measurable input. Default weights shown; "compete" / "acquire" / "invest" lenses re-weight without re-fetching.
Range:

💰 Forecast Revenue / mo

MODEL
Revenue forecast computed from BU's 234 trigger model on each snapshot. Calibrated against ground-truth from 58 verified-revenue apps.
🔬Forecast Breakdown — Why This Estimate?Top 4 of 4 triggers
Our ML model uses 200+ signals from public data. These are the most influential for this app:
High install base (1,615,301 ratings)METRIC
+$12,000
Excellent rating (4.8★)METRIC
+$2,200
Mature app (16y old)METRIC
+$1,500
Ad-supported / freemiumMETRIC
+$600
METRIC = structural app data · REVIEW = mined from user reviews · ✓ VERIFIED = Stripe-verified anchor (TrustMRR)

📈 Reviews Growth

LIVE
Cumulative review count from first BU snapshot. Each point = a tracked update.

⭐ Rating Trend

LIVE
Average rating evolution. Updates with each new review batch.

Profile & Insights

Everything we know — and don't — about this app and its company.

Identification

App name
Zillow: Homes for Sale & Rent
Developer
Zillow Group
Bundle ID
com.zillow.android.zillowmap
App Store URL
Open in App Store
Category
House & Home
Content rating
Not found
Languages
Not found

Company

Website
www.zillow.com
Tagline
Not found
Description
Not found
Founded
Not found
HQ / Address
Not found
Employees
Not found
Logo
Not found

Revenue

Verified revenue / mo
Not found
AI revenue estimate / mo
Not found
AI annual estimate
Not found
ML model estimate / mo
$5.7K/mo
Top-grossing rank
Not found
All-time revenue
Not found
Pricing
Not found

Founder

Founder data not yet collected for this app.

Funding

Funding data not yet collected for this app.

Press & Links

Press & Links data not yet collected for this app.

Contacts & Socials

Contacts & Socials data not yet collected for this app.
📈Ratings growth1,615,301 ratings+10% lifetimeShow 3-year history estimate ▾
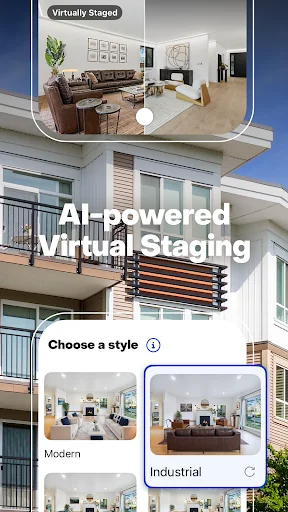
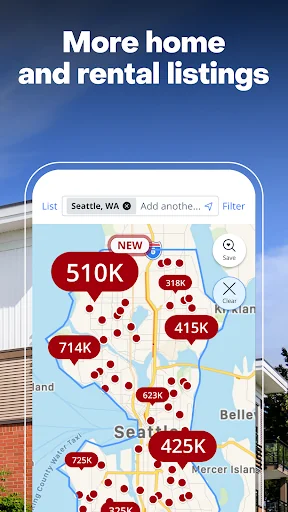
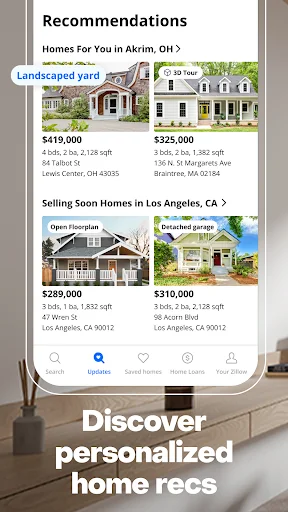
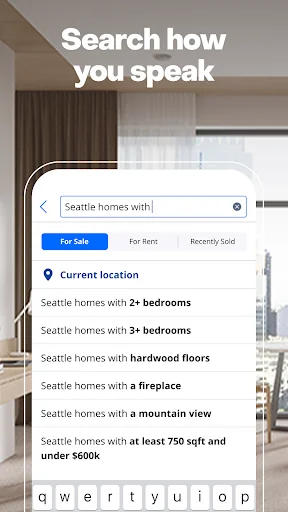
Jul 2023Feb 2025Jul 2026
Tracked (2 weeks) Pre-tracking estimate (37 weeks) · model-based, ±5% noise · anchored to release date and current value
🚀Version Release Timeline2 releases tracked
v2026.34.0.124980May 2026v2026.43.0.126350Jun 2026
Profile is built from iTunes Lookup + developer site scrape + ML revenue model. Empty fields show "Not found" — additional sources (Crunchbase, X, IndieHackers, Acquire.com) coming.

📝 About this app

Find your new home to buy or rent with expert real estate tools and millions of listings right at your fingertips. Seamlessly save, search, and share home listings and apartment rentals – all on the Zillow app.

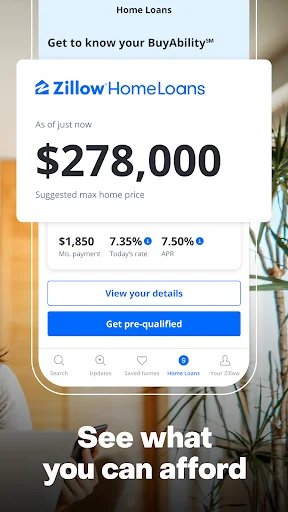
Check your BuyAbility℠ for an estimate of your home-buying budget based on your finances and current interest rates. Then, get a personalized shopping experience across listings and see the strength of potential offers as you search for a new home. Find a home you love? Discuss your mortgage options and get pre-approved with Zillow Home Loans.… View full description on the official store →
App Specs
🔐 Own this app? Claim & verify MRR →
🔖 v2026.43.0.126350🔄 updated 0d ago📂 House & Home💰 Free📺 Ad-supported
📅

What Worked™ · Development Pipeline

3 EVENTS TRACKED
Detected changes in this app over its tracked lifetime — each event links cause (what changed) to effect (what moved). Sorted newest first.See full history →Version history →
2026-06
📸
Refreshed store screenshots — 7 of 7 updated
2026-06
🔧
Shipped update — v2026.34.0.124980 → v2026.43.0.126350
→ 30 days after: reviews +17,458 low · multiple changes
2026-05
🚀
First tracked snapshot — initial data captured
→ 30 days after: reviews +17,458 high confidence
📸

Store Page History

7 SCREENSHOT CHANGES
Every time a developer swaps a store screenshot we archive both versions. Compare side-by-side to see what messaging / visuals changed.
iPhone screenshots
Slot 1
2 ver.
2026-05-06
Now
2026-06-12
Slot 2
2 ver.
2026-05-06
Now
2026-06-12
Slot 3
2 ver.
2026-05-06
Now
2026-06-12
Slot 4
2 ver.
2026-05-06
Now
2026-06-12
Slot 5
2 ver.
2026-05-06
Now
2026-06-12
Slot 6
2 ver.
2026-05-06
Now
2026-06-12
🔔

Track this app’s revenue

FREE
Get an email when revenue moves by your threshold. No spam, unsubscribe in one click.

📝 Description

95
BU Score · Transcendent
Full revenue analysis
Read the article-style breakdown for Zillow: Homes for Sale & Rent: category rank, percentile, growth signal, comparable apps, and how the forecast is calibrated against verified-MRR anchors in this niche.
Read deep-dive →

More by Zillow Group

View all →
📦 Portfolio summaryINDIE studio
2apps·$7K/mocombined
Lead-app heavy — top app contributes 73%

Similar apps in House & Home

About this analysis
ZCAnalyzed by Zakhar Chumak · founder, bumetric·Full methodology·High confidence

Why high confidence: 1,615,301 ratings · no founder-verified revenue (model estimate only).

Frequently Asked Questions

4 answers · auto-generated from this app's public data
How much does Zillow make per month?
Based on our ML-calibrated revenue forecast, Zillow earns approximately $5.7K/mo. This is a US-storefront-equivalent estimate; global revenue can be several times larger for internationally-distributed apps. See the methodology page for the full formula and confidence bands.
What apps are like Zillow?
Browse the full House & Home category catalog to find similar apps with revenue, build cost, audience and tech stack data. Each /p/{slug} page also shows a Compare side-by-side widget with three peer apps from the same niche.
Who makes Zillow?
Zillow is published by Zillow Group on the Google Play Store. See the full publisher portfolio (other apps by the same developer) via the More by developer block on the product page above.
What is Zillow's BU Score?
Zillow has a BU Score of 84/100 (Excellent). The score combines App Store rating, ratings count, monetization model and revenue signals calibrated against founder-verified MRR anchors. See the BU Score formula.