1.1M Android Apps Tracked Updated 1 min ago Revenue Forecasts
Create Account Sign In
Home

Last Day on Earth: Survival

82
Quality Score
Excellent

Last Day on Earth: Survival

High confidence
4.3 ✍️ Editor
✍️ bumetric analysis

This Android title carves out a strong niche in the zombie survival action genre, directly competing with titles like *State of Survival* and *Puzzles & Survival* by focusing on a more hardcore base-building and crafting loop. Its high rating from millions of users signals substantial, sustained traction, indicating a mature product with a loyal player base, well past its initial growth phase. Given its free monetization model, revenue is primarily driven by in-app purchases. In this category, a common monetization observation is the strong performance of battle passes or subscription models that offer consistent rewards and progression boosts, alongside direct sales of cosmetic items and resource packs, often seeing a 70/30 split between IAP and rewarded video ad revenue for non-paying users.

BU Score 82 · Excellent — strong product-market fit. The full Investment Matrix below scores 8 dimensions including monetisation, growth, and operational risk.

Track snapshot history and revenue forecast in the Performance section below.

💰 Monthly revenue · now vs forecast
● Right now
$7.7K
per month
12-mo forecast
$7.9K – $16.6K
per month
24-mo forecast
$9.8K – $29.4K
per month
MID tier
💡 Grow this revenue
Free AI audit of this app’s store listing
  • Title & subtitle keyword fit
  • Description hook & conversion structure
  • Screenshots, ratings, reviews strategy
Run free AI audit →
Typical impact: +2-5× organic installs
🔔Notify me when this app's revenue changes by

📊 Performance Tracking LIVE

Loading…
idle
0%
Rating
Reviews
Forecast Revenue / mo
Snapshots tracked
0
since first record
ONE-TIME · BUILD 💰 Estimated build cost
$170K
What it cost to build · not monthly revenue
Likely range $130K – $230K
$25K · MVP floor $100K · indie scale $500K+ · studio build
📈 Pays back in ~1.8y at current MRR

Synthetic estimate. Inputs: category complexity, file size, screen count, monetization layer, platform reach, age × team-size proxy. Calibrated against 2024-2026 indie-agency rate surveys. Full math + source list on /methodology.

Where the money goes
🧱 MVP baseline (design + 1-store ship) +$28K
📱 5 unique screens × $4.5K +$22K
Action complexity ×2.20 +$60K
🌐 Cross-platform reach (iOS + Android) +$61K
Total estimate $170K
ONE-TIME · EXIT VALUE 💵 Estimated acquisition value
$100K
What it would sell for · not monthly revenue
Marketplace range $75K – $125K · 14× MRR multiple
💸 ~0.6× build cost (under-water)

Synthetic estimate. Multiple band derived from ad-supported + age, rating quality, category demand, and user-base maturity. Calibrated against 2024-2026 indie-app-marketplace closed-deal medians. Full math + comparable deal list on /methodology.

How the multiple was built
📺 Ad-supported base 15× MRR
🏷 Action category multiple -15%
Mature user base (1M+ ratings) +8%
Final multiple 14× MRR
👥 Estimated audience size
711.5M
Lifetime downloads (US-equivalent)
Monthly active
71.0M
Daily active
24.5M

Synthetic estimate from ratings × category benchmarks. Calibrated against 2024-2026 mobile-attribution retention + DAU/MAU reports. Numbers are US-storefront-equivalent — true global audience can be 5-10× larger for international apps. Full math + source list on /methodology.

How we sized it
📲 Action engagement ~150 installs / rating
🔁 Action D30 retention 10%
📍 DAU / MAU stickiness 0.35
DAU / MAU 35% sticky
🛠 Estimated tech stack
🤖
Native Android (Kotlin)
Medium confidence · 55%
Also possible
Flutter

Heuristic guess from app bundle size, category, store description signals, and release-date stack era. Bumetric does not disassemble binaries — for binary-level certainty you would need an SDK intelligence tool or the manifest itself. Reasoning chain on the right. Full ruleset on /methodology.

Signals we read
🏷 Category context Action
📦 Tiny game bundle → Native 2D engine
🔬

How we forecast this revenue

MEDIUM CONFIDENCE
Baseline
$7.7K/mo · ML-estimated from 234 triggers
Growth rate
+4.0% MoM · MID tier baseline (compound monthly)
6 months
$7.3K – $12.1K
12 months
$7.9K – $16.6K
24 months
$9.8K – $29.4K
Compound growth at +4.0% MoM (tier baseline for MID). Range widens with horizon — typical noise band ±25% at 6mo.. Ranges widen with horizon — distant futures carry more uncertainty.
📊

BU Investment Matrix

Below median · 46/100MID TIERunderperforming peers
RevenueQualityMarketGrowthMoatSafetyFounderMonetiz.
Revenue Strength
3.9
Product Quality
8.7
Market Position
0.0
Growth Velocity
5.0
Defensibility
3.5
Operational Safety
10.0
Founder Strength
5.0
Monetization Maturity
1.0
  • 💰 Revenue: Modest — $5K - $11K/mo · MID tier · medium confidence, trajectory unclear.
  • ⭐ Quality: 4.35★ across 4,746,159 reviews — strong (top 10%).
  • 📍 Market: Not yet charting in any of the 9 monitored markets.
  • 📈 Growth: Insufficient signal to assess trajectory.
  • ⚠️ Risk: Low — no material risk signals detected.
🎯 For competitors: Mixed picture. Worth competing if you have a clear UX or pricing edge — otherwise crowded segment.
💵 For acquirers: Estimated asking range 18-32× monthly = $137K-$245K.
Composite of 8 dimensions computed deterministically from public signals — no LLM, every score traces back to a measurable input. Default weights shown; "compete" / "acquire" / "invest" lenses re-weight without re-fetching.
Range:

💰 Forecast Revenue / mo

MODEL
Revenue forecast computed from BU's 234 trigger model on each snapshot. Calibrated against ground-truth from 58 verified-revenue apps.
🔬Forecast Breakdown — Why This Estimate?Top 3 of 3 triggers
Our ML model uses 200+ signals from public data. These are the most influential for this app:
High install base (4,746,159 ratings)METRIC
+$12,000
Good rating (4.3★)METRIC
+$800
Ad-supported / freemiumMETRIC
+$600
METRIC = structural app data · REVIEW = mined from user reviews · ✓ VERIFIED = Stripe-verified anchor (TrustMRR)

📈 Reviews Growth

LIVE
Cumulative review count from first BU snapshot. Each point = a tracked update.

⭐ Rating Trend

LIVE
Average rating evolution. Updates with each new review batch.

Profile & Insights

Everything we know — and don't — about this app and its company.

Identification

App name
Last Day on Earth: Survival
Developer
KEFIR
Bundle ID
zombie.survival.craft.z
App Store URL
Open in App Store
Category
Action
Content rating
Not found
Languages
Not found

Company

Website
Not found
Tagline
Not found
Description
Not found
Founded
Not found
HQ / Address
Not found
Employees
Not found
Logo
Not found

Revenue

Verified revenue / mo
Not found
AI revenue estimate / mo
$2.0M ($1.8M – $2.2M)AI medium
AI annual estimate
$24.0M/yr
ML model estimate / mo
$7.7K/mo
Top-grossing rank
Not found
All-time revenue
Not found
Pricing
Not found

Founder

Founder data not yet collected for this app.

Funding

Funding data not yet collected for this app.

Press & Links

Press & Links data not yet collected for this app.

Contacts & Socials

Contacts & Socials data not yet collected for this app.
AI Revenue EstimateCONFIDENCE: MEDIUM
The Android app "Last Day on Earth: Survival" by KEFIR is estimated to generate approximately $2 million in monthly revenue, primarily from the US market. This projection is based on recent Sensor Tower data for both the Apple App Store and Google Play Store in the US, each contributing around $1 million monthly, and is corroborated by a Reddit discussion from June 2024.
Sources mentioned: Sensor Tower, Reddit
Profile is built from iTunes Lookup + developer site scrape + ML revenue model. Empty fields show "Not found" — additional sources (Crunchbase, X, IndieHackers, Acquire.com) coming.

📝 About this app

Last Day on Earth is a zombie survival action game with base building, crafting, and shooting zombies in a brutal post-apocalyptic world. Your life depends on how well you loot, craft, and build, turning whatever you find into weapons, gear, and a fortified shelter. Explore hostile lands, shoot zombies, and fight to protect everything you’ve worked for. In this zombie survival world, every piece of loot matters, every wall you build matters, and every mistake may be your last.

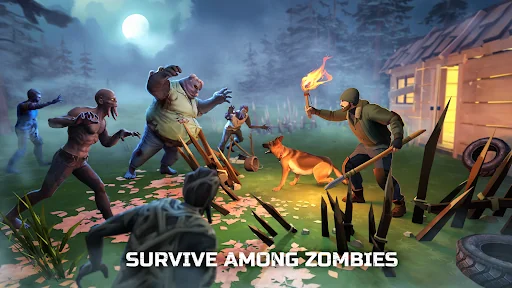
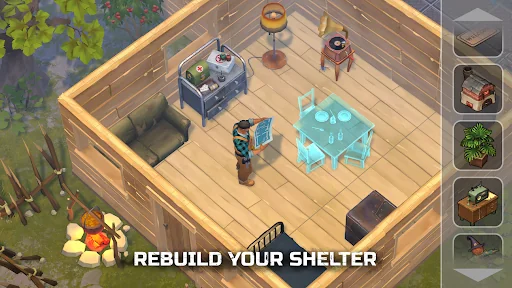
■ CRAFTING & BASE BUILDING
Survival begins with your two hands.… View full description on the official store →
App Specs
🔐 Own this app? Claim & verify MRR →
🔖 v1.48.5🔄 updated 0d ago📂 Action💰 Free
🔔

Track this app’s revenue

FREE
Get an email when revenue moves by your threshold. No spam, unsubscribe in one click.

📝 Description

95
BU Score · Transcendent
Full revenue analysis
Read the article-style breakdown for Last Day on Earth: Survival: category rank, percentile, growth signal, comparable apps, and how the forecast is calibrated against verified-MRR anchors in this niche.
Read deep-dive →

More by KEFIR

View all →
📦 Portfolio summaryINDIE studio
2apps·$10K/mocombined
Lead-app heavy — top app contributes 72%

Similar apps in Action

About this analysis
ZCAnalyzed by Zakhar Chumak · founder, bumetric·Full methodology·High confidence

Why high confidence: 4,746,159 ratings · no founder-verified revenue (model estimate only).

Frequently Asked Questions

4 answers · auto-generated from this app's public data
How much does Last Day on Earth make per month?
Based on our ML-calibrated revenue forecast, Last Day on Earth earns approximately $7.7K/mo. This is a US-storefront-equivalent estimate; global revenue can be several times larger for internationally-distributed apps. See the methodology page for the full formula and confidence bands.
What apps are like Last Day on Earth?
Browse the full Action category catalog to find similar apps with revenue, build cost, audience and tech stack data. Each /p/{slug} page also shows a Compare side-by-side widget with three peer apps from the same niche.
Who makes Last Day on Earth?
Last Day on Earth is published by KEFIR on the Google Play Store. See the full publisher portfolio (other apps by the same developer) via the More by developer block on the product page above.
What is Last Day on Earth's BU Score?
Last Day on Earth has a BU Score of 82/100 (Excellent). The score combines App Store rating, ratings count, monetization model and revenue signals calibrated against founder-verified MRR anchors. See the BU Score formula.