29K iOS Apps Tracked Updated 5 min ago Revenue Forecasts
Add an app Create Account Sign In
Home

Construction Cost Estimator

68
Quality Score
Solid

Construction Cost Estimator

Medium confidence
4.4 ✍️ Editor
✍️ bumetric analysis

Construction Cost Estimator is an iOS app from Wasatch Digital Media, Inc. in the Business category, currently rated 4.4★ across 502 ratings. Initial signal reads as largely positive sentiment, users highlighting consistency and feature depth.

Quality Score is 68: Solid (established niche player). For a Business app, that means established niche player. The full BU Investment Matrix below scores 8 dimensions including monetisation, growth, and operational risk.

Track changes month-over-month in the Performance section below: live snapshot history and revenue forecast included.

💰 Monthly revenue · now vs forecast
● Right now
$5.4K
per month
12-mo forecast
$5.6K – $11.7K
per month
24-mo forecast
$6.9K – $20.7K
per month
MID tierFREE
💡 Grow this revenue
Free AI audit of this app’s store listing
  • Title & subtitle keyword fit
  • Description hook & conversion structure
  • Screenshots, ratings, reviews strategy
Run free AI audit →
Typical impact: +2-5× organic installs
🔔Notify me when this app's revenue changes by

📊 Performance Tracking LIVE

Loading…
idle
0%
Rating
Reviews
Forecast Revenue / mo
Snapshots tracked
0
since first record
ONE-TIME · BUILD 💰 Estimated build cost
$90K
What it cost to build · not monthly revenue
Likely range $70K – $120K
$25K · MVP floor $100K · indie scale $500K+ · studio build
📈 Pays back in ~4 months at current MRR

Synthetic estimate. Inputs: category complexity, file size, screen count, monetization layer, platform reach, age × team-size proxy. Calibrated against 2024-2026 indie-agency rate surveys. Full math + source list on /methodology.

Where the money goes
🧱 MVP baseline (design + 1-store ship) +$28K
📱 5 unique screens × $4.5K +$22K
📦 Asset bundle (78 MB) +$11K
Business complexity ×1.50 +$30K
Total estimate $90K
ONE-TIME · EXIT VALUE 💵 Estimated acquisition value
$375K
What it would sell for · not monthly revenue
Marketplace range $275K – $475K · 16× MRR multiple
💸 ~4.2× return on build cost

Synthetic estimate. Multiple band derived from ad-supported + age, rating quality, category demand, and user-base maturity. Calibrated against 2024-2026 indie-app-marketplace closed-deal medians. Full math + comparable deal list on /methodology.

How the multiple was built
📺 Ad-supported base 15× MRR
★ rating ≥ 4.4 (solid) +8%
🏷 Business category multiple +10%
Small user base (<1K ratings) -8%
Final multiple 16× MRR
👥 Estimated audience size
32K
Lifetime downloads (US-equivalent)
Monthly active
7.1K
Daily active
2.1K

Synthetic estimate from ratings × category benchmarks. Calibrated against 2024-2026 mobile-attribution retention + DAU/MAU reports. Numbers are US-storefront-equivalent — true global audience can be 5-10× larger for international apps. Full math + source list on /methodology.

How we sized it
📲 Business engagement ~65 installs / rating
🔁 Business D30 retention 22%
📍 DAU / MAU stickiness 0.30
DAU / MAU 30% sticky
🔬

How we forecast this revenue

MEDIUM CONFIDENCE
Baseline
$5.4K/mo · ML-estimated from 234 triggers
Growth rate
+4.0% MoM · MID tier baseline (compound monthly)
Direction
Headwinds: review-mined risks present
6 months
$5.1K – $8.5K
12 months
$5.6K – $11.7K
24 months
$6.9K – $20.7K
Compound growth at +4.0% MoM (tier baseline for MID). Range widens with horizon — typical noise band ±25% at 6mo.. Ranges widen with horizon — distant futures carry more uncertainty.
📊

BU Investment Matrix

Stalled · 37/100MID TIERFREE (NO MONETIZATION)no growth momentum
GrowthFounderQualityRevenueMonetiz.MoatMarketSafety
Growth Velocity
5.0
Founder Strength
5.4
Product Quality
4.7
Revenue Strength
3.7
Monetization Maturity
0.5
Defensibility
4.5
Market Position
2.0
Operational Safety
3.6
  • 💰 Revenue: Modest — $3K - $8K/mo · MID tier · medium confidence, trajectory unclear.
  • ⭐ Quality: 4.4★ across 502 reviews — below category median.
  • 📍 Market: Not yet charting in any of the 9 monitored markets.
  • 📈 Growth: ⚠ last update 1143d ago — possibly dormant.
  • ⚠️ Risk: High — scam/fraud mentions detected, rating drift -0.78 ★ (recent 50 vs lifetime), dormant (1143d since update).
🎯 For competitors: Vulnerable. Quality drift + slow updates create a clear opening for a fresh competitor with active dev cadence.
💵 For acquirers: Estimated asking range 12-22× monthly = $64K-$118K. Portfolio play ($22K/mo combined) commands premium. Discount applied for operational risk..
Composite of 8 dimensions computed deterministically from public signals — no LLM, every score traces back to a measurable input. Default weights shown; "compete" / "acquire" / "invest" lenses re-weight without re-fetching.
Range:

💰 Forecast Revenue / mo

MODEL
Revenue forecast computed from BU's 234 trigger model on each snapshot. Calibrated against ground-truth from 58 verified-revenue apps.
🔬Forecast Breakdown — Why This Estimate?Top 11 of 11 triggers
Our ML model uses 200+ signals from public data. These are the most influential for this app:
Paid app ($0.00)METRIC
+$2,800
worth every pennyREVIEW
+$2,000
bugsREVIEW
−$1,800
5 starREVIEW
+$1,800
excellent appREVIEW
+$1,500
Mature app (13y old)METRIC
+$1,500
highly recommendREVIEW
+$1,400
slowREVIEW
−$1,200
Good rating (4.4★)METRIC
+$800
Early-stage install base (502 ratings)METRIC
+$400
Single-language (English only)METRIC
−$400
METRIC = structural app data · REVIEW = mined from user reviews · ✓ VERIFIED = Stripe-verified anchor (TrustMRR)

📈 Reviews Growth

LIVE
Cumulative review count from first BU snapshot. Each point = a tracked update.

⭐ Rating Trend

LIVE
Average rating evolution. Updates with each new review batch.

🆕 What's New · v4.0

Stability and performance improvements

Profile & Insights

Everything we know — and don't — about this app and its company.

Identification

App name
Construction Cost Estimator
Developer
Wasatch Digital Media, Inc.
Bundle ID
Not found
App Store URL
Open in App Store
Category
Business
Content rating
4+
Languages
EN

Company

Website
Not found
Tagline
Today
Description
Find apps and games for iPhone, iPad, Mac, and more on the App Store.
Founded
Not found
HQ / Address
Not found
Employees
Not found
Logo
Available

Revenue

Verified revenue / mo
Not found
AI revenue estimate / mo
Not found
AI annual estimate
Not found
ML model estimate / mo
$22.8K/mo
Top-grossing rank
Not found
All-time revenue
Not found
Pricing
Not found

Founder

Founder data not yet collected for this app.

Funding

Funding data not yet collected for this app.

Press & Links

Press & Links data not yet collected for this app.

Contacts & Socials

Contacts & Socials data not yet collected for this app.
📈Ratings growth502 ratings+311% lifetimeShow 3-year history estimate ▾Jun 2015Jan 2020Jun 2026
Tracked (59 weeks) Pre-tracking estimate (36 weeks) · model-based, ±5% noise · anchored to release date and current value
🌍Geographic ReachNot ranked
This app is currently outside the top 100 grossing in all 9 countries we monitor (US, UK, DE, FR, JP, CA, AU, BR, IN). Niche or new apps often launch this way — popularity rankings appear once daily revenue clears the regional threshold.
💰Pricing History$0.00 → $19.99 (+0%)
Profile is built from iTunes Lookup + developer site scrape + ML revenue model. Empty fields show "Not found" — additional sources (Crunchbase, X, IndieHackers, Acquire.com) coming.

📝 About this app

Construction Cost Estimator helps contractors and service companies quickly create on-site estimates for construction and repair projects. You can save time and money by creating the estimate on the spot and then emailing it to the customer as a PDF or printing a hardcopy.

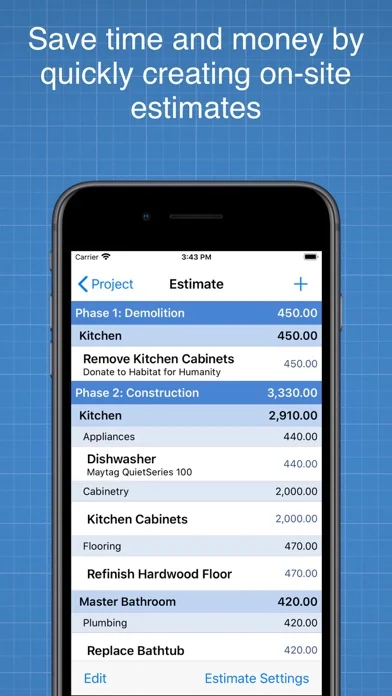
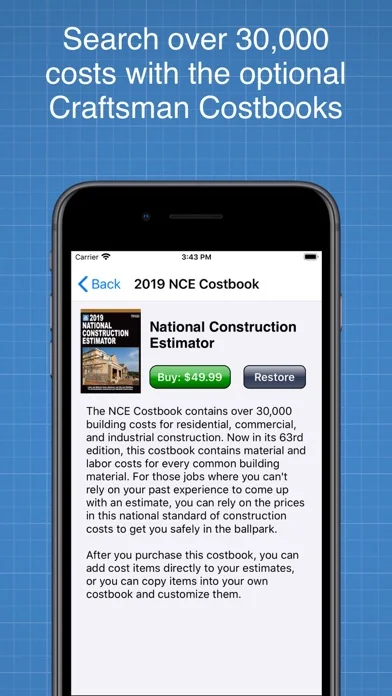
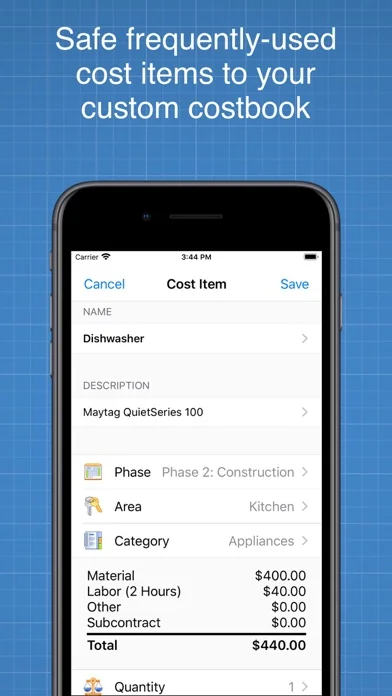
Each cost item is broken down into Material, Labor, Other, and Subcontract costs. You can save frequently used cost items in your own custom costbook, or you can purchase 3 different Craftsman costbooks within the app that contain detailed costs for over 30,000 common construction items.… View full description on the official store →
App Specs
🔐 Own this app? Claim & verify MRR →
💾 78 MB🔞 4+📱 iOS 12.0+🔖 v4.0🔄 updated 0d ago🌐 EN📂 Business💰 Paid
📅

What Worked™ · Development Pipeline

9 EVENTS TRACKED
Detected changes in this app over its tracked lifetime — each event links cause (what changed) to effect (what moved). Sorted newest first.See full history →Version history →
2026-05
Rating ↑ 4.40 → 4.81 (improved 0.41★)
2026-05
💲
Went paid — introduced $19.99 price point
2026-03
📈
Crossed 500 ratings — social-proof flywheel kicking in
2014-11
📈
Crossed 100 ratings — social-proof flywheel kicking in
2013-08
📈
Crossed 50 ratings — social-proof flywheel kicking in
2012-09
📈
Crossed 10 ratings — social-proof flywheel kicking in
2012-08
Rating ↑ 4.00 → 4.33 (improved 0.33★)
2012-08
Rating ↑ 3.00 → 4.00 (improved 1.00★)
2012-07
🚀
First tracked snapshot — initial data captured
🗣

Voice of Customer

Based on 200 reviews across 4 markets
● 90% positive  ·  ● 2% neutral  ·  ● 8% negative  ·  Rating drift: -0.78★ (declining — recent 50: 3.62★ vs lifetime: 4.4★)
−10+12012-Q32013-Q12013-Q22013-Q32013-Q42014-Q12014-Q22014-Q32014-Q42015-Q12015-Q22015-Q32015-Q42016-Q12016-Q3
VADER compound sentiment per quarter (−1 = fully negative, +1 = fully positive). Each point ≥ 5 reviews.
Sentiment by country (−1 to +1)
🇺🇸 US
+0.72
🇬🇧 GB
+0.70
🇨🇦 CA
+0.67
🇦🇺 AU
+0.63
Top praise themes
general contractor ×11 customer service ×10 worth money ×7 highly recommend ×6 before leave ×5 can't wait ×5 professional estimates ×4 user friendly ×4
Top complaint themes
books ×7 ipad ×7 purchase ×6 money ×5 buy ×5 estimating ×4 disappointed ×4 don't ×4
Risk signals
Fraud / scam mentions: 1.0%
🌍

Multi-Country Performance

Available in 9 of 9 monitored markets
MarketRatingReviewsCurrent version
🇦🇺 AU4.66667★34.66667★ this version
🇧🇷 BR3★13★ this version
🇨🇦 CA4.875★244.875★ this version
🇩🇪 DE0★0
🇫🇷 FR5★15★ this version
🇬🇧 GB4.38462★134.38462★ this version
🇮🇳 IN0★0
🇯🇵 JP0★0
🇺🇸 US4.80671★5074.80671★ this version
🔔

Track this app’s revenue

FREE
Get an email when revenue moves by your threshold. No spam, unsubscribe in one click.

📝 Description

95
BU Score · Transcendent
Full revenue analysis
Read the article-style breakdown for Construction Cost Estimator: category rank, percentile, growth signal, comparable apps, and how the forecast is calibrated against verified-MRR anchors in this niche.
Read deep-dive →

Similar apps in Business

About this analysis
ZCAnalyzed by Zakhar Chumak · founder, bumetric·Full methodology·Medium confidence

Why medium confidence: 502 ratings · no founder-verified revenue (model estimate only).

Frequently Asked Questions

4 answers · auto-generated from this app's public data
How much does Construction Cost Estimator make per month?
Based on our ML-calibrated revenue forecast, Construction Cost Estimator earns approximately $22K/mo. This is a US-storefront-equivalent estimate; global revenue can be several times larger for internationally-distributed apps. See the methodology page for the full formula and confidence bands.
What apps are like Construction Cost Estimator?
Browse the full Business category catalog to find similar apps with revenue, build cost, audience and tech stack data. Each /p/{slug} page also shows a Compare side-by-side widget with three peer apps from the same niche.
Who makes Construction Cost Estimator?
Construction Cost Estimator is published by Wasatch Digital Media, Inc. on the Apple App Store. See the full publisher portfolio (other apps by the same developer) via the More by developer block on the product page above.
What is Construction Cost Estimator's BU Score?
Construction Cost Estimator has a BU Score of 68/100 (Solid). The score combines App Store rating, ratings count, monetization model and revenue signals calibrated against founder-verified MRR anchors. See the BU Score formula.