29K iOS Apps Tracked Updated just now Revenue Forecasts
Add an app Create Account Sign In
Home

KicksOnFire: Release Dates

81
Quality Score
Excellent

KicksOnFire: Release Dates

High confidence
4.8 ✍️ Editor
✍️ bumetric analysis

KicksOnFire: Release Dates is an iOS app from KicksOnFire in the Shopping category, currently rated 4.8★ across 362,807 ratings. Initial signal reads as mixed reviews: supporters praise core features while critics cite stability and value gaps.

Quality Score is 81: Excellent (strong product-market fit). For a Shopping app, that means strong product-market fit. The full BU Investment Matrix below scores 8 dimensions including monetisation, growth, and operational risk.

Track changes month-over-month in the Performance section below: live snapshot history and revenue forecast included.

💰 Monthly revenue · now vs forecast
● Right now
$46.1K
per month
12-mo forecast
$47.8K – $100.0K
per month
24-mo forecast
$59.1K – $177.4K
per month
MID tier
💡 Grow this revenue
Free AI audit of this app’s store listing
  • Title & subtitle keyword fit
  • Description hook & conversion structure
  • Screenshots, ratings, reviews strategy
Run free AI audit →
Typical impact: +2-5× organic installs
🔔Notify me when this app's revenue changes by

📊 Performance Tracking LIVE

Loading…
idle
0%
Rating
Reviews
Forecast Revenue / mo
Snapshots tracked
0
since first record
ONE-TIME · BUILD 💰 Estimated build cost
$65K
What it cost to build · not monthly revenue
Likely range $50K – $90K
$25K · MVP floor $100K · indie scale $500K+ · studio build
📈 Pays back in ~3.8y at current MRR

Synthetic estimate. Inputs: category complexity, file size, screen count, monetization layer, platform reach, age × team-size proxy. Calibrated against 2024-2026 indie-agency rate surveys. Full math + source list on /methodology.

Where the money goes
🧱 MVP baseline (design + 1-store ship) +$28K
📱 5 unique screens × $4.5K +$22K
Shopping complexity ×1.30 +$15K
Total estimate $65K
ONE-TIME · EXIT VALUE 💵 Estimated acquisition value
$25K
What it would sell for · not monthly revenue
Marketplace range $20K – $35K · 18× MRR multiple
💸 ~0.4× build cost (under-water)

Synthetic estimate. Multiple band derived from ad-supported + age, rating quality, category demand, and user-base maturity. Calibrated against 2024-2026 indie-app-marketplace closed-deal medians. Full math + comparable deal list on /methodology.

How the multiple was built
📺 Ad-supported base 15× MRR
★ rating ≥ 4.7 (premium) +15%
🏷 Shopping category multiple +2%
Mature user base (100K+ ratings) +5%
Final multiple 18× MRR
👥 Estimated audience size
36.0M
Lifetime downloads (US-equivalent)
Monthly active
4.3M
Daily active
770K

Synthetic estimate from ratings × category benchmarks. Calibrated against 2024-2026 mobile-attribution retention + DAU/MAU reports. Numbers are US-storefront-equivalent — true global audience can be 5-10× larger for international apps. Full math + source list on /methodology.

How we sized it
📲 Shopping engagement ~100 installs / rating
🔁 Shopping D30 retention 12%
📍 DAU / MAU stickiness 0.18
DAU / MAU 18% sticky
🔬

How we forecast this revenue

MEDIUM CONFIDENCE
Baseline
$46.1K/mo · ML-estimated from 234 triggers
Growth rate
+4.0% MoM · MID tier baseline (compound monthly)
6 months
$43.8K – $73.0K
12 months
$47.8K – $100.0K
24 months
$59.1K – $177K
Compound growth at +4.0% MoM (tier baseline for MID). Range widens with horizon — typical noise band ±25% at 6mo.. Ranges widen with horizon — distant futures carry more uncertainty.
📊

BU Investment Matrix

Below median · 47/100MID TIERunderperforming peers
RevenueQualityMarketGrowthMoatSafetyFounderMonetiz.
Revenue Strength
4.7
Product Quality
9.6
Market Position
0.0
Growth Velocity
5.0
Defensibility
4.5
Operational Safety
9.0
Founder Strength
4.2
Monetization Maturity
1.0
  • 💰 Revenue: Modest — $32K - $69K/mo · MID tier · medium confidence, trajectory unclear.
  • ⭐ Quality: 4.82★ across 362,807 reviews — exceptional (top 1% in category).
  • 📍 Market: Not yet charting in any of the 9 monitored markets.
  • 📈 Growth: last update 287d ago — slow cadence.
  • ⚠️ Risk: Low — no material risk signals detected.
🎯 For competitors: Mixed picture. Worth competing if you have a clear UX or pricing edge — otherwise crowded segment.
💵 For acquirers: Estimated asking range 18-32× monthly = $830K-$1.5M.
Composite of 8 dimensions computed deterministically from public signals — no LLM, every score traces back to a measurable input. Default weights shown; "compete" / "acquire" / "invest" lenses re-weight without re-fetching.
Range:

💰 Forecast Revenue / mo

MODEL
Revenue forecast computed from BU's 234 trigger model on each snapshot. Calibrated against ground-truth from 58 verified-revenue apps.
🔬Forecast Breakdown — Why This Estimate?Top 11 of 11 triggers
Our ML model uses 200+ signals from public data. These are the most influential for this app:
High install base (362,807 ratings)METRIC
+$12,000
Paid app ($0.00)METRIC
+$2,800
Excellent rating (4.8★)METRIC
+$2,200
bugsREVIEW
−$1,800
5 starREVIEW
+$1,800
cancelledREVIEW
−$1,500
excellent appREVIEW
+$1,500
Mature app (13y old)METRIC
+$1,500
Multilingual (31 languages)METRIC
+$1,500
highly recommendREVIEW
+$1,400
slowREVIEW
−$1,200
METRIC = structural app data · REVIEW = mined from user reviews · ✓ VERIFIED = Stripe-verified anchor (TrustMRR)

📈 Reviews Growth

LIVE
Cumulative review count from first BU snapshot. Each point = a tracked update.

⭐ Rating Trend

LIVE
Average rating evolution. Updates with each new review batch.

🆕 What's New · v4.3.0

We’ve made it even easier to stay ahead of the game! The latest update brings a smoother browsing experience, faster sneaker release alerts, and improved personalization so you never miss the drops you care about most.

Profile & Insights

Everything we know — and don't — about this app and its company.

Identification

App name
KicksOnFire: Release Dates
Developer
KicksOnFire
Bundle ID
com.kicksonfire.kicksonfire
App Store URL
Open in App Store
Category
Shopping
Content rating
4+
Languages
AR, CA, CS, DA, NL, EN, FI, FR, DE, EL, HE, HU, ID, IT, JA, KO, MS, NB, PL, PT, RO, RU, ZH, SK, ES, SV, TH, ZH, TR, UK, VI

Company

Website
Not found
Tagline
Today
Description
Find apps and games for iPhone, iPad, Mac, and more on the App Store.
Founded
Not found
HQ / Address
Not found
Employees
Not found
Logo
Available

Revenue

Verified revenue / mo
Not found
AI revenue estimate / mo
$98 ($13 – $182)AI low
AI annual estimate
$1.2K/yr
ML model estimate / mo
$1.4K/mo
Top-grossing rank
Outside top 100 in US Shopping
All-time revenue
Not found
Pricing
Not found

Founder

Founder data not yet collected for this app.

Funding

Funding data not yet collected for this app.

Press & Links

Press & Links data not yet collected for this app.

Contacts & Socials

Contacts & Socials data not yet collected for this app.
AI Revenue EstimateCONFIDENCE: LOW
Based on limited Sensor Tower data for Q1 2025, the iOS app "KicksOnFire: Release Dates" is estimated to have a monthly revenue between $13 and $182, leading to an annual estimate of approximately $1,176. These figures primarily reflect in-app purchase revenue in specific regions (Russia and UK) and may not include global revenue or other monetization methods like advertising or affiliate commissions.
Sources mentioned: Sensor Tower, Apple App Store, Reddit, Google Play
Recent App Store Reviews49 latest · avg 2.86★ · 38.8% 5★ · 44.9% 1★
5★
19 (39%)
4★
3 (6%)
3★
1 (2%)
2★
4 (8%)
1★
22 (45%)
+134 ratings/week
Praise: great ×4 love ×4 awesome ×2 best ×2 favorite ×1Complaints: crash ×5 bug ×1 scam ×1 expensive ×1 refund ×1
Top positive
★★★★★ App Not working
My order won’t let me track it and customer service not responding…
★★★★★ Come Here First if you need to know
This App is Great every shoe you need to know about when it comes out I Love this App 🔥🔥🔥…
Top negative
★☆☆☆☆ New releases
How do 30 shoe come out in the same day. Like just show what’s going to be released and the actual datelll…
★☆☆☆☆ Crashing
Keeps crashing…
📈Ratings growth362,807 ratings+15% lifetimeShow 3-year history estimate ▾
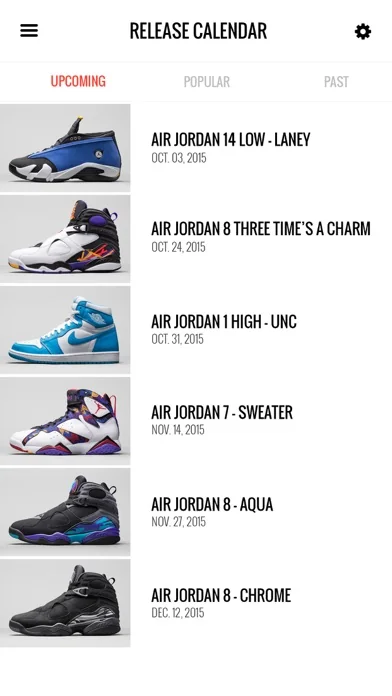
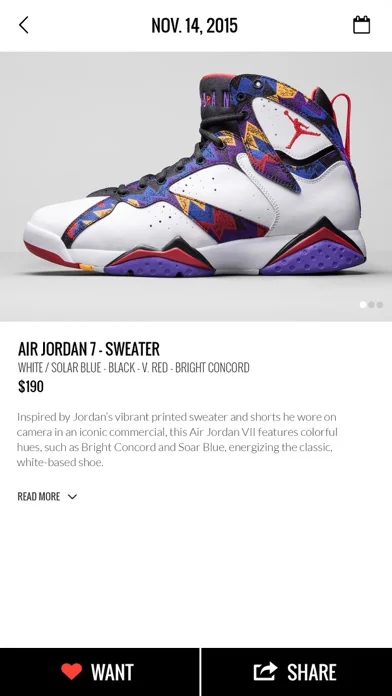
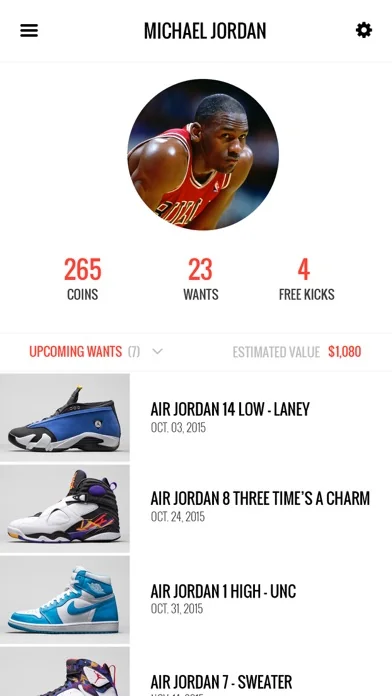
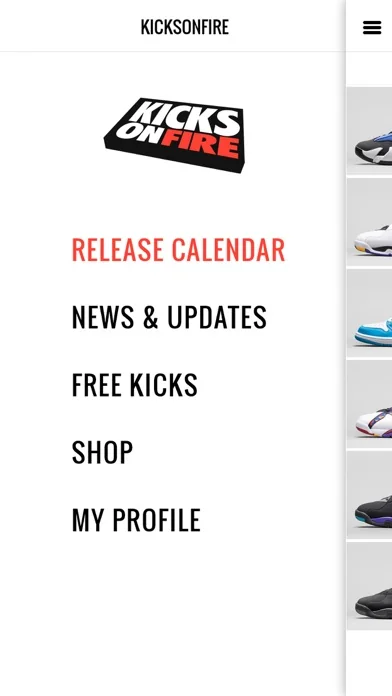
Jun 2023Feb 2025Jun 2026
Tracked (56 weeks) Pre-tracking estimate (35 weeks) · model-based, ±5% noise · anchored to release date and current value
🌍Geographic ReachNot ranked
This app is currently outside the top 100 grossing in all 9 countries we monitor (US, UK, DE, FR, JP, CA, AU, BR, IN). Niche or new apps often launch this way — popularity rankings appear once daily revenue clears the regional threshold.
Profile is built from iTunes Lookup + developer site scrape + ML revenue model. Empty fields show "Not found" — additional sources (Crunchbase, X, IndieHackers, Acquire.com) coming.

📝 About this app

- Shop your favorite sneakers.
- Most downloaded Release Calendar app.
- Up to date Release Dates & Sneaker News.
- Price guide with interactive charts.
- Win free shoes weekly.

The heart and soul of the sneaker community, KicksOnFire is the top authority for sneaker culture, news and shoe history.

Our mission is to provide an accessible information platform for the sneaker community and tools to facilitate the shopping experience for any footwear consumer.… View full description on the official store →
App Specs
🔐 Own this app? Claim & verify MRR →
💾 37 MB🔞 4+📱 iOS 13.0+🔖 v4.3.0🔄 updated 0d ago🌐 AR, CA, CS, DA, NL +26📂 Shopping💰 Paid
📅

What Worked™ · Development Pipeline

6 EVENTS TRACKED
Detected changes in this app over its tracked lifetime — each event links cause (what changed) to effect (what moved). Sorted newest first.See full history →Version history →
2026-05
🔄
Monetization changed: paid → free
2026-03
Rating ↑ 4.11 → 4.68 (improved 0.57★)
2026-03
📈
Crossed 1,000 ratings — social-proof flywheel kicking in
2026-03
📈
Crossed 500 ratings — social-proof flywheel kicking in
2021-03
🚀
First tracked snapshot — initial data captured
2021-03
📈
Crossed 10 ratings — social-proof flywheel kicking in
🔔

Track this app’s revenue

FREE
Get an email when revenue moves by your threshold. No spam, unsubscribe in one click.

📝 Description

95
BU Score · Transcendent
Full revenue analysis
Read the article-style breakdown for KicksOnFire: Release Dates: category rank, percentile, growth signal, comparable apps, and how the forecast is calibrated against verified-MRR anchors in this niche.
Read deep-dive →

Similar apps in Shopping

About this analysis
ZCAnalyzed by Zakhar Chumak · founder, bumetric·Full methodology·High confidence

Why high confidence: 362,807 ratings · no founder-verified revenue (model estimate only).

Frequently Asked Questions

4 answers · auto-generated from this app's public data
How much does KicksOnFire make per month?
Based on our ML-calibrated revenue forecast, KicksOnFire earns approximately $1.4K/mo. This is a US-storefront-equivalent estimate; global revenue can be several times larger for internationally-distributed apps. See the methodology page for the full formula and confidence bands.
What apps are like KicksOnFire?
Browse the full Shopping category catalog to find similar apps with revenue, build cost, audience and tech stack data. Each /p/{slug} page also shows a Compare side-by-side widget with three peer apps from the same niche.
Who makes KicksOnFire?
KicksOnFire is published by KicksOnFire on the Apple App Store. See the full publisher portfolio (other apps by the same developer) via the More by developer block on the product page above.
What is KicksOnFire's BU Score?
KicksOnFire has a BU Score of 81/100 (Excellent). The score combines App Store rating, ratings count, monetization model and revenue signals calibrated against founder-verified MRR anchors. See the BU Score formula.