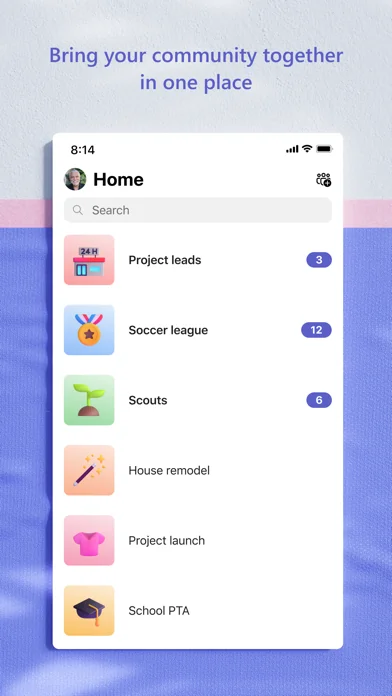
29K iOS Apps Tracked Updated 5 min ago Revenue Forecasts
Add an app Create Account Sign In
Home

Microsoft Teams

91
Quality Score
Transcendent

Microsoft Teams

High confidence
4.8 ✍️ Editor
✍️ bumetric analysis

This app targets the enterprise collaboration and communication niche, directly competing with platforms like Slack, Zoom, and Google Workspace. Its substantial user base, evidenced by millions of ratings and a strong average rating, indicates significant market penetration and sustained traction since its 2016 launch. The consistent revenue, approaching $50,000 monthly, suggests a mature product with established user acquisition and retention, likely fueled by its integration within the broader Microsoft ecosystem. For paid business applications in this category, a common monetization strategy involves tiered subscription models, often with a freemium entry point for individuals or small teams, escalating to per-user enterprise licenses that bundle additional features, storage, and advanced administrative controls. This approach allows for broad adoption while capturing value from professional and corporate users requiring robust functionality.

BU Score 91 · Transcendent — category-leading momentum. The full Investment Matrix below scores 8 dimensions including monetisation, growth, and operational risk.

Track snapshot history and revenue forecast in the Performance section below.

💰 Monthly revenue · now vs forecast
● Right now
$10.0M
per month
12-mo forecast
$10.3M – $13.6M
per month
24-mo forecast
$11.4M – $17.2M
per month
MEGA tier
💡 Grow this revenue
Free AI audit of this app’s store listing
  • Title & subtitle keyword fit
  • Description hook & conversion structure
  • Screenshots, ratings, reviews strategy
Run free AI audit →
Typical impact: +2-5× organic installs
🔔Notify me when this app's revenue changes by

📊 Performance Tracking LIVE

Loading…
idle
0%
Rating
Reviews
Forecast Revenue / mo
Snapshots tracked
0
since first record
ONE-TIME · BUILD 💰 Estimated build cost
$135K
What it cost to build · not monthly revenue
Likely range $100K – $180K
$25K · MVP floor $100K · indie scale $500K+ · studio build
📈 Pays back in ~3 months at current MRR

Synthetic estimate. Inputs: category complexity, file size, screen count, monetization layer, platform reach, age × team-size proxy. Calibrated against 2024-2026 indie-agency rate surveys. Full math + source list on /methodology.

Where the money goes
🧱 MVP baseline (design + 1-store ship) +$28K
📱 5 unique screens × $4.5K +$22K
📦 Asset bundle (475 MB) +$40K
Business complexity ×1.50 +$45K
Total estimate $135K
ONE-TIME · EXIT VALUE 💵 Estimated acquisition value
$1.0M
What it would sell for · not monthly revenue
Marketplace range $700K – $1.2M · 20× MRR multiple
💸 ~7.4× return on build cost

Synthetic estimate. Multiple band derived from ad-supported + age, rating quality, category demand, and user-base maturity. Calibrated against 2024-2026 indie-app-marketplace closed-deal medians. Full math + comparable deal list on /methodology.

How the multiple was built
📺 Ad-supported base 15× MRR
★ rating ≥ 4.7 (premium) +15%
🏷 Business category multiple +10%
Mature user base (1M+ ratings) +8%
Final multiple 20× MRR
👥 Estimated audience size
218.0M
Lifetime downloads (US-equivalent)
Monthly active
47.5M
Daily active
14.0M

Synthetic estimate from ratings × category benchmarks. Calibrated against 2024-2026 mobile-attribution retention + DAU/MAU reports. Numbers are US-storefront-equivalent — true global audience can be 5-10× larger for international apps. Full math + source list on /methodology.

How we sized it
📲 Business engagement ~65 installs / rating
🔁 Business D30 retention 22%
📍 DAU / MAU stickiness 0.30
DAU / MAU 29% sticky
🔬

How we forecast this revenue

MEDIUM CONFIDENCE
Baseline
$10.0M/mo · ML-estimated from 234 triggers
Growth rate
+1.5% MoM · MEGA tier baseline (compound monthly)
6 months
$9.8M – $12.0M
12 months
$10.3M – $13.6M
24 months
$11.4M – $17.2M
Compound growth at +1.5% MoM (tier baseline for MEGA). Range widens with horizon — typical noise band ±10% at 6mo.. Ranges widen with horizon — distant futures carry more uncertainty.
📊

BU Investment Matrix

Mixed signals · 63/100MEGA TIERcompetitive but cautious
GrowthFounderQualityRevenueMonetiz.MoatMarketSafety
Growth Velocity
5.0
Founder Strength
8.2
Product Quality
9.6
Revenue Strength
7.0
Monetization Maturity
1.0
Defensibility
7.4
Market Position
2.0
Operational Safety
10.0
  • 💰 Revenue: Strong — $4.0M - $20.0M/mo · MEGA tier · low confidence, trajectory unclear.
  • ⭐ Quality: 4.8★ across 3,358,300 reviews — exceptional (top 1% in category).
  • 📍 Market: Not yet charting in any of the 9 monitored markets.
  • 📈 Growth: Insufficient signal to assess trajectory.
  • ⚠️ Risk: Low — no material risk signals detected.
🎯 For competitors: Mixed picture. Worth competing if you have a clear UX or pricing edge — otherwise crowded segment.
💵 For acquirers: Estimated asking range 32-48× monthly = $320.0M-$480.0M.
Composite of 8 dimensions computed deterministically from public signals — no LLM, every score traces back to a measurable input. Default weights shown; "compete" / "acquire" / "invest" lenses re-weight without re-fetching.
Range:

💰 Forecast Revenue / mo

MODEL
Revenue forecast computed from BU's 234 trigger model on each snapshot. Calibrated against ground-truth from 58 verified-revenue apps.
🔬Forecast Breakdown — Why This Estimate?Top 10 of 10 triggers
Our ML model uses 200+ signals from public data. These are the most influential for this app:
High install base (3,358,300 ratings)METRIC
+$12,000
Paid app ($0.00)METRIC
+$2,800
subscriptionREVIEW
+$2,500
Excellent rating (4.8★)METRIC
+$2,200
bugsREVIEW
−$1,800
5 starREVIEW
+$1,800
securityREVIEW
+$1,800
Mature app (9y old)METRIC
+$1,500
Multilingual (47 languages)METRIC
+$1,500
slowREVIEW
−$1,200
METRIC = structural app data · REVIEW = mined from user reviews · ✓ VERIFIED = Stripe-verified anchor (TrustMRR)

📈 Reviews Growth

LIVE
Cumulative review count from first BU snapshot. Each point = a tracked update.

⭐ Rating Trend

LIVE
Average rating evolution. Updates with each new review batch.

🆕 What's New · v8.9.0

Bug fixes and performance improvements

Profile & Insights

Everything we know — and don't — about this app and its company.

Identification

App name
Microsoft Teams
Developer
Microsoft Corporation
Bundle ID
com.microsoft.skype.teams
App Store URL
Open in App Store
Category
Business
Content rating
4+
Languages
AR, BN, BG, CA, HR, CS, DA, NL, EN, ET, FI, FR, DE, EL, GU, HE, HI, HU, IS, ID, IT, JA, KN, KO, LV, LT, ML, MR, NB, NN, PL, PT, RO, RU, SR, ZH, SK, SL, ES, SV, TA, TE, TH, ZH, TR, UK, VI

Company

Website
aka.ms
Tagline
Not found
Description
Microsoft's internal link redirection service management interface
Founded
Not found
HQ / Address
Not found
Employees
Not found
Logo
Not found

Revenue

Verified revenue / mo
Not found
AI revenue estimate / mo
$30.0K ($18.0K – $42.0K)AI medium
AI annual estimate
$360.0K/yr
ML model estimate / mo
$46.5K/mo
Top-grossing rank
🇮🇳#68 /100   🇯🇵#92 /100   🇧🇷#94 /100
All-time revenue
Not found
Pricing
Not found

Founder

Founder data not yet collected for this app.

Funding

Funding data not yet collected for this app.

Press & Links

Press & Links data not yet collected for this app.

Contacts & Socials

Contacts & Socials data not yet collected for this app.
AI Revenue EstimateCONFIDENCE: MEDIUM
The iOS app "Microsoft Teams" is estimated to generate approximately $30,000 in monthly revenue, leading to an annual estimate of $360,000. This revenue likely stems from in-app purchases for linked SaaS offers or personal app contexts, as the core Teams functionality is typically bundled with Microsoft 365 subscriptions.
Sources mentioned: Sensor Tower, Microsoft Learn
📈Ratings growth3,358,300 ratings+35% lifetimeShow 3-year history estimate ▾Jun 2023Nov 2025Jun 2026
Tracked (23 weeks) Pre-tracking estimate (36 weeks) · model-based, ±5% noise · anchored to release date and current value
🌍Top Countries — Grossing Rank3 countries
🇮🇳IN
#68 /100
🇯🇵JP
#92 /100
🇧🇷BR
#94 /100
📊Category Rank Trajectory#68 now · best #60 · worst #100
Lower line = better rank · Estimate from ratings growth model · Lower position on chart = worse rank · Higher = top of chart
Profile is built from iTunes Lookup + developer site scrape + ML revenue model. Empty fields show "Not found" — additional sources (Crunchbase, X, IndieHackers, Acquire.com) coming.

📝 About this app

Whether you’re connecting with your community for an upcoming activity or working with teammates on a project, Microsoft Teams helps bring people together so that they can get things done. It’s the only app that has communities, events, chats, channels, meetings, storage, tasks, and calendars in one place—so you can easily connect and manage access to information. Get your community, family, friends, or workmates together to accomplish tasks, share ideas, and make plans.… View full description on the official store →
App Specs
🔐 Own this app? Claim & verify MRR →
💾 475 MB🔞 4+📱 iOS 17.0+🔖 v8.9.0🔄 updated 0d ago🌐 AR, BN, BG, CA, HR +42📂 Business💰 Paid
📅

What Worked™ · Development Pipeline

13 EVENTS TRACKED
Detected changes in this app over its tracked lifetime — each event links cause (what changed) to effect (what moved). Sorted newest first.See full history →Version history →
2026-05
🔄
Monetization changed: paid → free
2026-05
🔧
Shipped update — v? → v8.8.0
2026-03
Rating ↑ 1.91 → 4.70 (improved 2.79★)
2026-03
📈
Crossed 1,000 ratings — social-proof flywheel kicking in
2026-03
📈
Crossed 500 ratings — social-proof flywheel kicking in
2025-09
📈
Crossed 100 ratings — social-proof flywheel kicking in
2025-08
📈
Crossed 50 ratings — social-proof flywheel kicking in
2025-08
Rating ↑ 2.29 → 2.63 (improved 0.34★)
2025-08
📈
Crossed 10 ratings — social-proof flywheel kicking in
2025-07
Rating ↑ 1.83 → 2.29 (improved 0.46★)
2025-07
Rating ↑ 1.50 → 2.00 (improved 0.50★)
2025-07
🚀
First tracked snapshot — initial data captured
2025-07
Rating ↑ 1.00 → 1.33 (improved 0.33★)
🔎

ASO Keyword Positions

BEST RANK #1
Ranked for 3 App Store search queryies in our last keyword sweep. Lower position = closer to the top.
team chat·#1🇺🇸group chat·#17🇺🇸messaging·#28🇺🇸
Last sweep: 2026-05-19 · iTunes Search API
🌍

Multi-Country Performance

Available in 9 of 9 monitored markets
MarketRatingReviewsCurrent version
🇦🇺 AU4.72871★363,8834.72871★ this version
🇧🇷 BR4.84457★433,9024.84457★ this version
🇨🇦 CA4.70793★547,0364.70793★ this version
🇩🇪 DE4.65608★546,3424.65608★ this version
🇫🇷 FR4.68804★337,9704.68804★ this version
🇬🇧 GB4.66188★751,9884.66188★ this version
🇮🇳 IN4.76206★630,8884.76206★ this version
🇯🇵 JP4.464★404,3524.464★ this version
🇺🇸 US4.80086★3,360,4164.80086★ this version
🔔

Track this app’s revenue

FREE
Get an email when revenue moves by your threshold. No spam, unsubscribe in one click.

📝 Description

95
BU Score · Transcendent
Full revenue analysis
Read the article-style breakdown for Microsoft Teams: category rank, percentile, growth signal, comparable apps, and how the forecast is calibrated against verified-MRR anchors in this niche.
Read deep-dive →

More by Microsoft Corporation

View all →
📦 Portfolio summaryMID studio
103apps·$496K/mocombined
✓ Diversified — top app contributes 11%; risk spread across portfolio

Similar apps in Business

About this analysis
ZCAnalyzed by Zakhar Chumak · founder, bumetric·Full methodology·High confidence

Why high confidence: 3,358,300 ratings · no founder-verified revenue (model estimate only).

Frequently Asked Questions

4 answers · auto-generated from this app's public data
How much does Microsoft Teams make per month?
Based on our ML-calibrated revenue forecast, Microsoft Teams earns approximately $46K/mo. This is a US-storefront-equivalent estimate; global revenue can be several times larger for internationally-distributed apps. See the methodology page for the full formula and confidence bands.
What apps are like Microsoft Teams?
Browse the full Business category catalog to find similar apps with revenue, build cost, audience and tech stack data. Each /p/{slug} page also shows a Compare side-by-side widget with three peer apps from the same niche.
Who makes Microsoft Teams?
Microsoft Teams is published by Microsoft Corporation on the Apple App Store. See the full publisher portfolio (other apps by the same developer) via the More by developer block on the product page above.
What is Microsoft Teams's BU Score?
Microsoft Teams has a BU Score of 91/100 (Transcendent). The score combines App Store rating, ratings count, monetization model and revenue signals calibrated against founder-verified MRR anchors. See the BU Score formula.