29K iOS Apps Tracked Updated 1 min ago Revenue Forecasts
Add an app Create Account Sign In
Home

Portfolio Performance

52
Quality Score
Solid

Portfolio Performance

Low confidence
5.0 ✍️ Editor
✍️ bumetric analysis

Portfolio Performance is an iOS app from MSM Mannheimer Software-Manufaktur UG (haftungsbeschränkt) in the Finance category, currently rated 5.0★ across 3 ratings. Initial signal reads as no scraped reviews yet: judgment based on metadata only.

Quality Score is 52: Solid (established niche player). For a Finance app, that means established niche player. The full BU Investment Matrix below scores 8 dimensions including monetisation, growth, and operational risk.

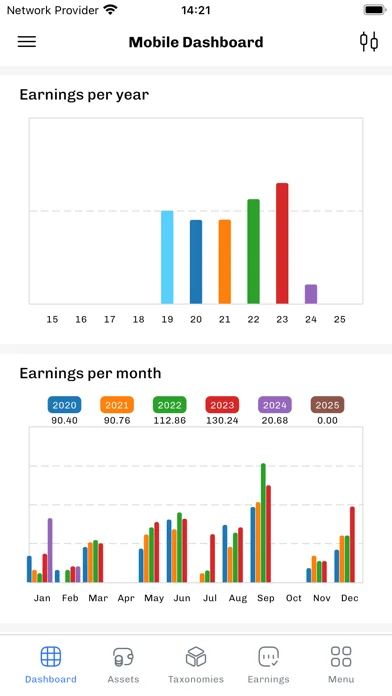
Track changes month-over-month in the Performance section below: live snapshot history and revenue forecast included.

💰 Monthly revenue · now vs forecast
● Right now
$3.7K
per month
12-mo forecast
$3.2K – $11.6K
per month
24-mo forecast
$3.0K – $26.8K
per month
INDIE tierFREE
💡 Grow this revenue
Free AI audit of this app’s store listing
  • Title & subtitle keyword fit
  • Description hook & conversion structure
  • Screenshots, ratings, reviews strategy
Run free AI audit →
Typical impact: +2-5× organic installs
🔔Notify me when this app's revenue changes by

📊 Performance Tracking LIVE

Loading…
idle
0%
Rating
Reviews
Forecast Revenue / mo
Snapshots tracked
0
since first record
ONE-TIME · BUILD 💰 Estimated build cost
$85K
What it cost to build · not monthly revenue
Likely range $65K – $115K
$25K · MVP floor $100K · indie scale $500K+ · studio build
📈 Slow ROI — current MRR is well below build cost

Synthetic estimate. Inputs: category complexity, file size, screen count, monetization layer, platform reach, age × team-size proxy. Calibrated against 2024-2026 indie-agency rate surveys. Full math + source list on /methodology.

Where the money goes
🧱 MVP baseline (design + 1-store ship) +$28K
📱 5 unique screens × $4.5K +$22K
📦 Asset bundle (56 MB) +$2K
Finance complexity ×1.60 +$31K
Total estimate $85K
ONE-TIME · EXIT VALUE 💵 Estimated acquisition value
$15K
What it would sell for · not monthly revenue
Marketplace range $10K – $20K · 18× MRR multiple
💸 ~0.2× build cost (under-water)

Synthetic estimate. Multiple band derived from ad-supported + age, rating quality, category demand, and user-base maturity. Calibrated against 2024-2026 indie-app-marketplace closed-deal medians. Full math + comparable deal list on /methodology.

How the multiple was built
📺 Ad-supported base 15× MRR
★ rating ≥ 4.7 (premium) +15%
🏷 Finance category multiple +15%
Small user base (<1K ratings) -8%
Final multiple 18× MRR
🔬

How we forecast this revenue

MEDIUM CONFIDENCE
Baseline
$3.7K/mo · ML-estimated from 234 triggers
Growth rate
+6.0% MoM · INDIE tier baseline (compound monthly)
Direction
Headwinds: rating drift may slow acquisition, low defensibility moat
6 months
$3.1K – $7.3K
12 months
$3.2K – $11.6K
24 months
$3.0K – $26.8K
Compound growth at +6.0% MoM (tier baseline for INDIE). Range widens with horizon — typical noise band ±40% at 6mo.. Ranges widen with horizon — distant futures carry more uncertainty.
📊

BU Investment Matrix

Pre-traction · 36/100INDIE TIERFREE (NO MONETIZATION)limited signal
GrowthFounderQualityRevenueMonetiz.MoatMarketSafety
Growth Velocity
5.0
Founder Strength
3.9
Product Quality
2.5
Revenue Strength
3.6
Monetization Maturity
0.5
Defensibility
2.6
Market Position
2.0
Operational Safety
8.5
  • 💰 Revenue: Modest — $1K - $9K/mo · INDIE tier · medium confidence, trajectory unclear.
  • ⭐ Quality: 5.0★ across 3 reviews — weak — significant quality concerns.
  • 📍 Market: Not yet charting in any of the 9 monitored markets.
  • 📈 Growth: Insufficient signal to assess trajectory.
  • ⚠️ Risk: Low — rating drift -0.98 ★ (recent 50 vs lifetime).
🎯 For competitors: Mixed picture. Worth competing if you have a clear UX or pricing edge — otherwise crowded segment.
💵 For acquirers: Estimated asking range 18-32× monthly = $66K-$117K.
Composite of 8 dimensions computed deterministically from public signals — no LLM, every score traces back to a measurable input. Default weights shown; "compete" / "acquire" / "invest" lenses re-weight without re-fetching.
Range:

💰 Forecast Revenue / mo

MODEL
Revenue forecast computed from BU's 234 trigger model on each snapshot. Calibrated against ground-truth from 58 verified-revenue apps.
🔬Forecast Breakdown — Why This Estimate?Top 5 of 5 triggers
Our ML model uses 200+ signals from public data. These are the most influential for this app:
Paid app ($0.00)METRIC
+$2,800
Excellent rating (5.0★)METRIC
+$2,200
Single-language (English only)METRIC
−$400
Pre-traction phase (3 ratings)METRIC
−$300
Growing app (2y old)METRIC
+$200
METRIC = structural app data · REVIEW = mined from user reviews · ✓ VERIFIED = Stripe-verified anchor (TrustMRR)

📈 Reviews Growth

LIVE
Cumulative review count from first BU snapshot. Each point = a tracked update.

⭐ Rating Trend

LIVE
Average rating evolution. Updates with each new review batch.

🆕 What's New · v1.11.1

This version fixes a small issue when updating historical prices from the navigation bar menu.

Happy investment tracking!

Profile & Insights

Everything we know — and don't — about this app and its company.

Identification

App name
Portfolio Performance
Developer
MSM Mannheimer Software-Manufaktur UG (haftungsbeschränkt)
Bundle ID
software.msm.portfolio-performance
App Store URL
Open in App Store
Category
Finance
Content rating
17+
Languages
EN

Company

Website
Not found
Tagline
Portfolio Performance
Description
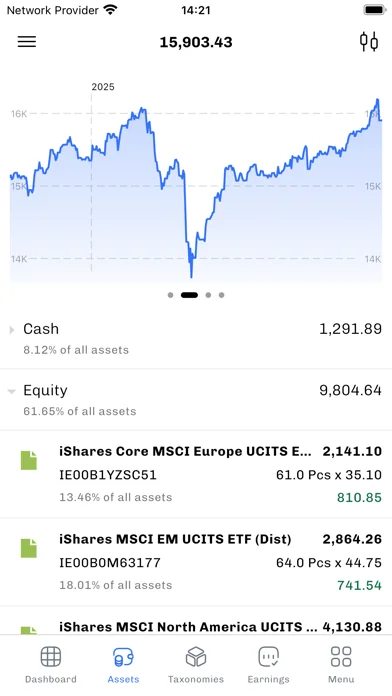
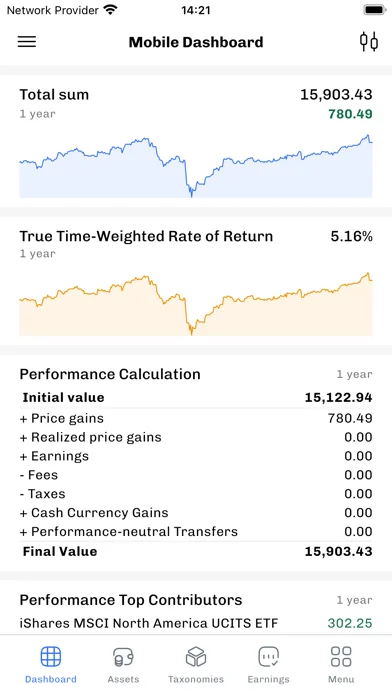
Portfolio Performance App: Track your investments while on the move.
Founded
Not found
HQ / Address
Not found
Employees
Not found
Logo
Available

Revenue

Verified revenue / mo
Not found
AI revenue estimate / mo
Not found
AI annual estimate
Not found
ML model estimate / mo
$746/mo
Top-grossing rank
🇩🇪#35 /100
All-time revenue
Not found
Pricing
Not found

Founder

Founder data not yet collected for this app.

Funding

Funding data not yet collected for this app.

Press & Links

Press & Links data not yet collected for this app.

Contacts & Socials

Contacts & Socials data not yet collected for this app.
📈Ratings growth3 ratingsShow 3-year history estimate ▾Feb 2024May 2025Jun 2026
Tracked (2 weeks) Pre-tracking estimate (29 weeks) · model-based, ±5% noise · anchored to release date and current value
🗺️Geographic Distribution1 of 9 markets
🇩🇪
DE
Top-grossing rank: #35 / 100
Other markets
Outside top 100
in US, GB, DE, FR, JP, CA, AU, BR, IN
This app currently ranks in only one of the 9 markets we monitor. Niche or regional apps often launch this way before global rollout. Rankings update daily.
📊Category Rank Trajectory#35 now · best #4 · worst #61
Lower line = better rank · Estimate from ratings growth model · Lower position on chart = worse rank · Higher = top of chart
Profile is built from iTunes Lookup + developer site scrape + ML revenue model. Empty fields show "Not found" — additional sources (Crunchbase, X, IndieHackers, Acquire.com) coming.

📝 About this app

Track your investments. Confidentially. Portfolio Performance is the mobile companion for users of the popular free and open-source Portfolio Performance desktop application. This app is your gateway to tracking investments on the move, complementing the desktop version's capabilities. Edit and maintain your transaction history on the desktop, then view and analyze your investments on your device.


How does it work?

The mobile application reads the same data file as the desktop version. When you assign a password, the file is secured with industry-standard AES256 encryption.… View full description on the official store →
App Specs
🔐 Own this app? Claim & verify MRR →
💾 56 MB🔞 17+📱 iOS 13.0+🔖 v1.11.1🔄 updated 0d ago🌐 EN📂 Finance💰 Paid
📅

What Worked™ · Development Pipeline

2 EVENTS TRACKED
Detected changes in this app over its tracked lifetime — each event links cause (what changed) to effect (what moved). Sorted newest first.See full history →Version history →
2026-05
🔄
Monetization changed: paid → free
2026-03
🚀
First tracked snapshot — initial data captured
🗣

Voice of Customer

Based on 50 reviews across 1 markets
● 8% positive  ·  ● 10% neutral  ·  ● 82% negative  ·  Rating drift: -0.98★ (declining — recent 50: 4.02★ vs lifetime: 5.0★)
−10+12024-Q12024-Q22024-Q4
VADER compound sentiment per quarter (−1 = fully negative, +1 = fully positive). Each point ≥ 5 reviews.
Top praise themes
auf dem ×12 desktop version ×10 für die ×8 die ist ×8 die desktop ×6 die entwickler ×5 und die ×5 ich nutze ×5
Top complaint themes
die datei ×5 auf dem ×3 ich die ×3 nicht ×8 aber ×7 wird ×4 der ×4 unbrauchbar ×4
🌍

Multi-Country Performance

Available in 8 of 9 monitored markets
MarketRatingReviewsCurrent version
🇦🇺 AU0★0
🇧🇷 BR5★15★ this version
🇨🇦 CA4.5★24.5★ this version
🇩🇪 DE4.66505★2064.66505★ this version
🇬🇧 GB5★45★ this version
🇮🇳 IN4★24★ this version
🇯🇵 JP0★0
🇺🇸 US5★35★ this version
🔔

Track this app’s revenue

FREE
Get an email when revenue moves by your threshold. No spam, unsubscribe in one click.

📝 Description

95
BU Score · Transcendent

Similar apps in Finance

About this analysis
ZCAnalyzed by Zakhar Chumak · founder, bumetric·Full methodology·Low confidence

Why low confidence: only 3 ratings · no founder-verified revenue (model estimate only) · revenue figure is directional only.

📌 Final verdict — read this before you trust the numbers above

Portfolio Performance is a very early-stage iOS app in the finance space with weak public traction — only 3 ratings, no founder-verified MRR, and not ranked in any monitored grossing chart. The app appears to be monetised, but public signals are too sparse for a precise revenue estimate.

Bottom line: treat all revenue, audience and acquisition-value numbers on this page as directional only — not founder-verified facts.

Frequently Asked Questions

4 answers · auto-generated from this app's public data
How much does Portfolio Performance make per month?
Low-confidence model estimate. Portfolio Performance has only 3 App Store ratings, so our revenue model has very little signal to work with — treat the ~$746/mo figure as directional only, not a verified MRR. No founder-verified revenue data is available for this app. See methodology for the formula and confidence bands.
What apps are like Portfolio Performance?
Browse the full Finance category catalog to find similar apps with revenue, build cost, audience and tech stack data. Each /p/{slug} page also shows a Compare side-by-side widget with three peer apps from the same niche.
Who makes Portfolio Performance?
Portfolio Performance is published by MSM Mannheimer Software-Manufaktur UG (haftungsbeschränkt) on the Apple App Store. See the full publisher portfolio (other apps by the same developer) via the More by developer block on the product page above.
What is Portfolio Performance's BU Score?
Portfolio Performance has a BU Score of 52/100 (Solid). The score combines App Store rating, ratings count, monetization model and revenue signals calibrated against founder-verified MRR anchors. See the BU Score formula.